

Economic indicators provide insight into the overall health and performance of an economy. They serve as essential tools for policymakers, advisors, investors, and businesses because they allow them to make informed decisions regarding business strategies and financial markets. In the week ending on November 2nd, the SPDR S&P 500 ETF Trust (SPY ) rose 4.41% while the Invesco S&P 500® Equal Weight ETF (RSP ) was up 3.02%.
Among all economic indicators, some of the most closely watched are those regarding employment updates. As it is at the beginning of every month, the labor market took center stage as several key reports were released last week. It all began on Wednesday with the release of September’s Job Openings and Labor Turnover (JOLTS) report and October’s ADP Employment Report and then culminated on Friday with the BLS’s October Employment Report. Each of these reports offers a unique perspective as they each focus on different aspects of the U.S. labor market.
Job Openings and Labor Turnover (JOLTS)
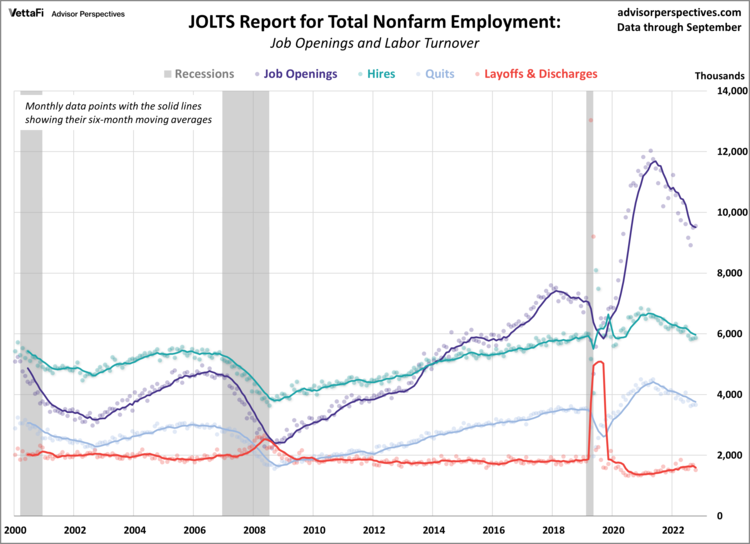
The September JOLTS report highlighted a persistently tight labor market as job openings increased for a second consecutive month. In September, job openings inched up by 56,000 from August, reaching 9.553 million. The recent uptick surprised economists who predicted vacancies would drop to 9.250 million. Additionally, other key data points from the report showed that the number of quits and hires remained flat compared to the previous month while the number of layoffs fell to a nine-month low.
The JOLTS data serves as a crucial barometer for assessing labor demand, and any disparity between workforce demand and supply could potentially exert upward pressure on inflation. While the latest report reflects a resilient labor market, it’s worth noting that the number of job openings per unemployed worker remained relatively steady at 1.50. This marks the second lowest level since September 2021 with only last month’s figure coming in lower at 1.49. Moreover, the overall trend in job openings continues to steadily decline from its 2022 peak.
Employment Report
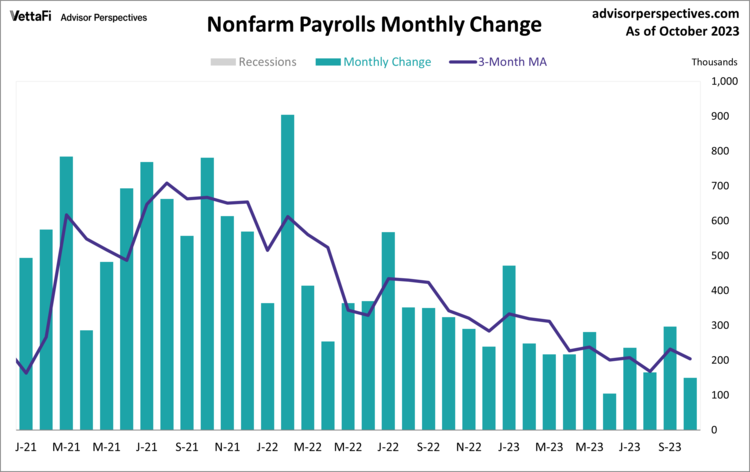
The U.S. labor market cooled further last month as job growth slowed and the unemployment rate ticked up. The October employment report revealed 150,000 jobs were added last month, falling short of the expected 180,000 addition. October’s jobs numbers were the smallest monthly increase since June. Moreover, the report indicated that the unemployment rate rose to 3.9%, while wage growth slowed to 4.1%. The labor force participation rate inched down to 62.7%. Overall, the jobs report showed solid job growth but still provided enough balance for the Fed to allow them to keep rates on hold and assess if the slowdown in the job market will continue.
ADP Employment Report
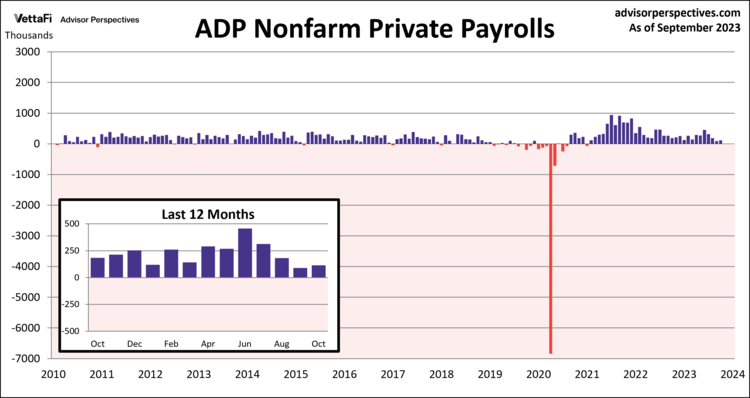
Private sector hiring was slower than expected in October, a further indication that the Fed’s high interest rates are taking effect on the labor market. The ADP employment report showed that 113,000 private jobs were add last month, less than the projected 150,000 addition. The latest figure marked the first time job growth has picked up in the past four months. However, it is the second smallest monthly increase since January 2021 with only last month’s 89,000 addition coming in lower. The pickup this month was most notable among companies with 50-249 employees, as they added 96,000 jobs, accounting for 85% of October’s job growth. Another significant detail from the report was the continued deceleration of annual pay growth, which fell to its slowest pace in two years at 5.7%. The slower than expected job growth and continued slowdown in pay serves as a positive signal for the Federal Reserve, suggesting that inflationary pressures, such as wage gains, are easing.
Economic Indicators and the Week Ahead
This upcoming week will be light in terms of new economic data. With that said, there are still a few important indicators to keep an eye out for – November’s preliminary reading for the Michigan Consumer Sentiment Index, September’s Trade Balance, and the Q3 Household Debt and Credit report.
The preliminary report for the Michigan Consumer Sentiment Index, which could impact interest in the Consumer Discretionary Select Sector SPDR ETF (XLY ), is predicted to increase from October’s final reading of 63.8 to 65.0. The trade deficit is expected to widen to -$60.30 billion. Lastly, household debt and credit has increased every quarter since Q2 2020 so it is expected for each of these balances to have risen in Q3.
For more news, information, and analysis, visit the Innovative ETFs Channel.

