

Economic indicators play a central role in understanding the health and performance of the U.S. economy. They are essential tools for policymakers, advisors, investors, and businesses because they allow them to make informed decisions regarding business strategies and financial markets. In the week ending February 22, there were notable market reactions to economic news. The SPDR S&P 500 ETF Trust (SPY ) rose 1.09%, while the Invesco S&P 500 Equal Weight ETF (RSP ) was up 0.50%.
This article highlights two indicators from the past week — existing home sales, and the Conference Board’s Leading Economic Index (LEI). Examining these data points provides valuable information about different aspects of the country’s overall economic health and can be considered leading economic indicators.
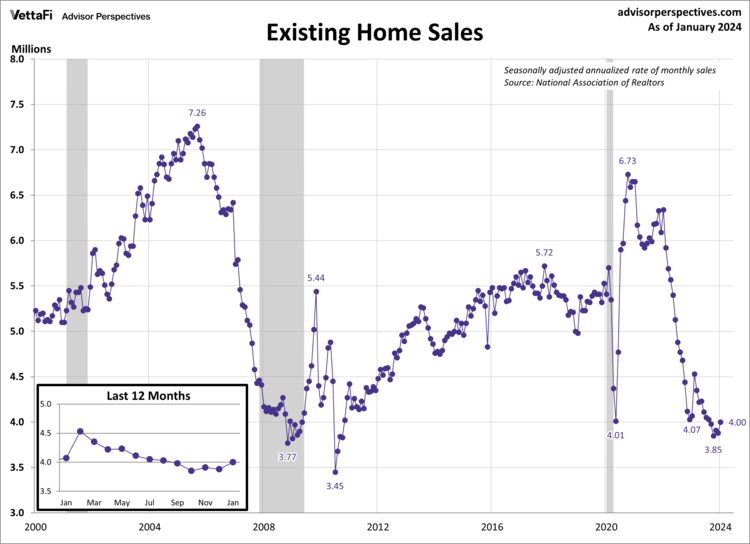
Existing Home Sales
Existing home sales jumped to a five-month high in January as homebuyers continued to take advantage of relatively lower mortgage rates. In January, existing home sales rose 3.1%, reaching a seasonally adjusted annual rate of 4.00 million units. This increase reverses the consistent downward trend seen in existing home sales over the past two years, which have declined 19 of the past 24 months. The latest figure was higher than expected, with sales surpassing the projected 3.96 million units. While inventory remains limited, recent drops in mortgage rates have led to increased listings and an overall improvement in home sales.
Potential homebuyers continue to face competition in the housing market as they grapple with low inventory. As a result, multiple offers on a home are leading to subsequent price hikes. The median price for an existing home sold last month was $379,100, an all-time high for the month of January. This represents a 5.1% increase compared to one year ago, marking the seventh consecutive month of year-over-year increases for existing homes.
Existing home sales could impact residential real-estate ETFs such as the iShares Residential and Multisector Real Estate ETF (REZ ).
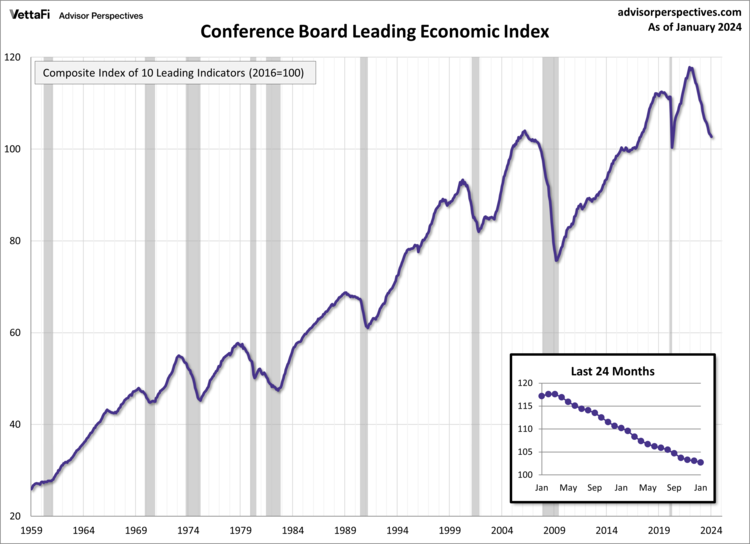
Leading Economic Index
The Conference Board Leading Economic Index (LEI), a composite index designed to predict the economy’s trajectory, fell further last month, but it is no longer signaling a recession for 2024. January marked the 22nd consecutive month of decline for the LEI, with a 0.4% drop to 102.7 – its lowest level since May 2020. However, for the first time in two years, six out of the index’s 10 components were positive contributors over the past six-month period. As a result, the Conference Board has updated its forecast to reflect no recession in 2024 despite continued economic headwinds in the near term. The only other time the index has declined longer than 22 months was during the run-up to the Great Recession (2007-2009).
Economic Indicators and the Week Ahead
The upcoming week will deliver some of the most closely watched data that provides insight into economic growth, consumption, and consumer attitudes. On Tuesday, the Conference Board will report the February reading for its Consumer Confidence Index. Consumer attitudes have improved each of the last three months, which could impact the Consumer Discretionary Select Sector SPDR ETF (XLY ). Then on Wednesday, the Bureau of Economic Analysis (BEA) will release the second estimate of the 2023 Q4 GDP. As a reminder, the 2023 Q4 advance estimate came in at 3.3%, a slower pace than the 2023 Q3 final estimate of 4.9%. Lastly, the BEA will publish January’s PCE price index data on Thursday. The core PCE price index, the Fed’s preferred measure of inflation, will tell us if inflation continues its downward trend towards the Fed’s 2% target rate.
See latest economic video on January employment.
For more news, information, and analysis, visit the Innovative ETFs Channel.

