


Economic indicators are released every week to provide insight into the overall health and performance of an economy. They serve as essential tools for policymakers, advisors, investors, and businesses because they allow them to make informed decisions regarding business strategies and financial markets. In the week ending March 7, the SPDR S&P 500 ETF Trust (SPY ) rose 1.32% while the Invesco S&P 500 Equal Weight ETF (RSP ) was up 1.79%.
Among all economic indicators, some of the most closely watched are those surrounding the labor market. They garner so much attention for a variety of reasons. First, they provide insight into the health of the economy. Second, they impact individual’s lives, which can influence consumer behavior and investor sentiment. And third, they inform government policy decisions.
Last week featured a handful of employment updates including the BLS’ February Employment Report, January’s Job Openings and Labor Turnover (JOLTS) report, and February’s ADP Private Employment Report. Each of these reports offer insights into different aspects of the U.S. labor market. This article will highlight the key data points from each report and explore their potential implications.
Economic Indicators: Employment Report
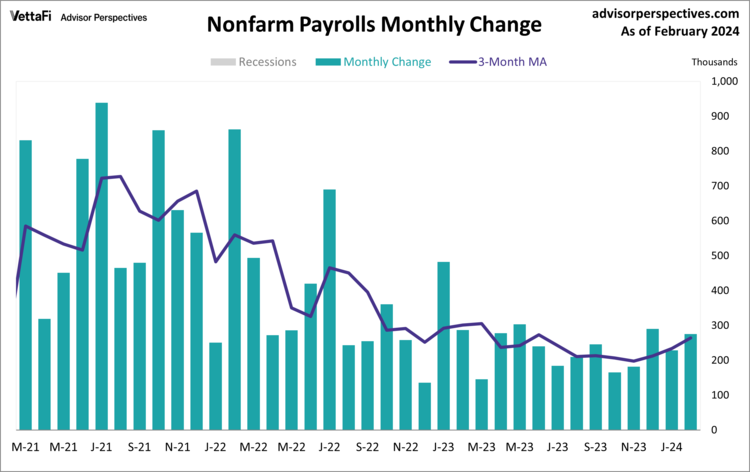
The U.S. labor market added more jobs than expected last month. However, a surprising uptick in the unemployment rate along with downward revisions to prior months points to a cooling labor market. The February employment report revealed 275,000 jobs were added last month. That surpasses the expected 198,000 addition. The two previous months’ jobs numbers were also revised lower. That suggests the labor market is not as strong as initially thought. February’s jobs numbers were a slight pickup from January’s revised 229,000 addition.
The report also indicated the unemployment rate rose to 3.9%. That is its highest level since January 2022. Additionally, wage growth increased 0.1% from January, lower than the expected 0.2% growth and slowed to 4.3% on an annual basis. Overall, the jobs report showed unexpected softening of the labor market despite the hotter-than-anticipated job growth. Regarding the Fed, rate cuts later this year should still be on the horizon. However, the timing remains uncertain.
Economic Indicators: Job Openings and Labor Turnover (JOLTS)
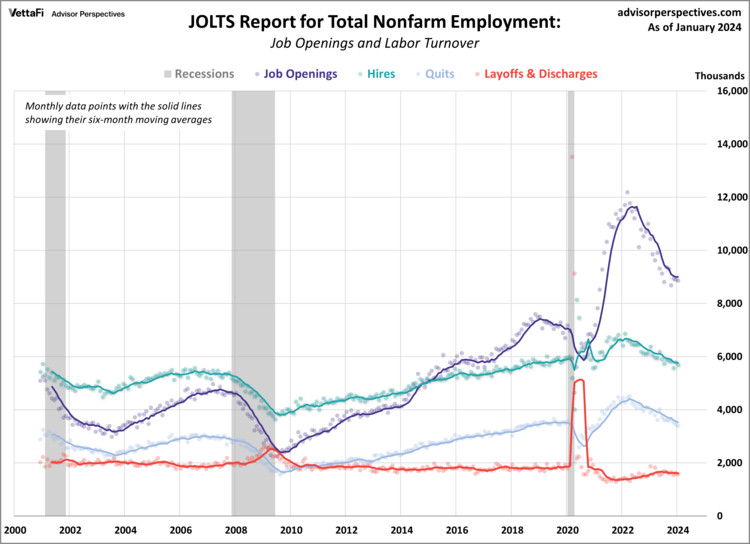
The latest JOLTS report revealed that the labor market was little changed in January. The number of job openings inched down by 26,000 from December to 8.863 million. It came in just above the predicted 8.800 million vacancies. Other key data points from the report showed that the number of hires and quits fell slightly from the previous month. Hires dropped 100,000 to 5.7 million and quits fell 54,000 to 3.4 million. Meanwhile, the number of layoffs was stable, at 1.6 million.
The JOLTS data serves as a barometer for assessing labor demand. Any disparity between workforce demand and supply could potentially exert upward pressure on inflation. For much of 2023, the gap between the two had consistently narrowed. That’s because the overall trend in job openings steadily declined from its 2022 peak. However, in January, the number of job openings per employed worker ticked up to 1.5. That is its highest level in the past four months.
Economic Indicators: ADP Employment Report
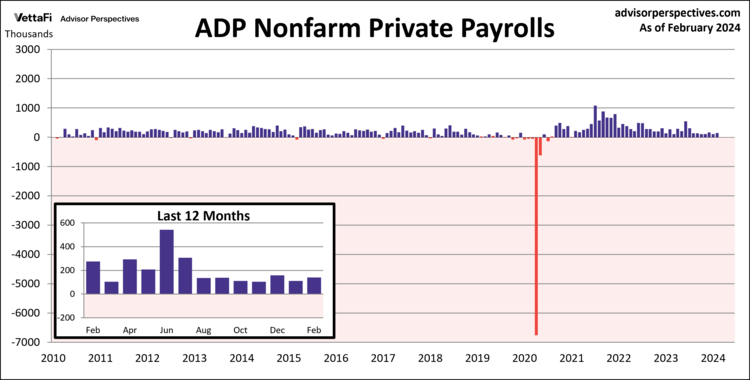
Private sector hiring remained steady last month. The ADP employment report showed that 140,000 private jobs were added last month, just below the projected 149,000 addition. The pickup in February was most notable among large (500+ employees) to midsize (50-249 employees) companies, as they added 114,000 jobs combined, accounting for approximately 81% of February’s private job growth. The six-month moving average, a more stable indicator amid monthly volatility, inched up for the first time in five months to 127,000. However, despite the slight increase, the latest average is the second lowest level since November 2020 during the peak of COVID-19 layoffs.
The report also highlights a continued deceleration in annual pay growth, with pay gains for job-stayers dropping to 5.1%, the slowest since August 2021. The stabilization of job growth, coupled with the ongoing deceleration in pay growth in the private sector, offers the Fed a positive indication that inflationary pressures remain subdued.
The Week Ahead
The upcoming week will feature the latest inflation, consumer spending, and consumer sentiment data. On Tuesday, the Bureau of Labor Statistics will release February’s Consumer Price Index (CPI). Headline consumer prices are expected to increase 0.4%, while core prices are expected to increase 0.3% from January. Then on Thursday, the Census Bureau will release retail sales data for February. Retail sales, which will impact interests in the SPDR S&P Retail ETF (XRT ), are expected to rise 0.5% from January. Finally, on Friday, the preliminary report for the Michigan Consumer Sentiment Index, which could impact interest in the Consumer Discretionary Select Sector SPDR ETF (XLY ), is predicted to remain at February’s final reading of 76.9.
For more news, information, and analysis, visit the Innovative ETFs Channel.

