

Economic indicators are released every week to provide insight into the overall health and performance of an economy. They serve as essential tools for policymakers, advisors, investors, and businesses because they allow them to make informed decisions regarding business strategies and financial markets. In the week ending March 20, the SPDR S&P 500 ETF Trust (SPY ) rose 1.72 , while the Invesco S&P 500 Equal Weight ETF (RSP ) was up 2.23.
Last week, the U.S. housing market took center stage, with data releases on several housing-related indicators. This article highlights a handful of these crucial housing indicators from the past week, such as existing home sales, housing starts, builder confidence, and building permits. These indicators provide a comprehensive overview of the housing market, offering insights into both supply and demand dynamics, as well as market sentiment.
The housing indicators discussed in this article could impact home builders and residential real estate ETFs such as the Invesco Dynamic Building & Construction ETF (PKB ), iShares U.S. Home Construction ETF (ITB ), SPDR S&P Homebuilders ETF (XHB ), and iShares Residential and Multisector Real Estate ETF (REZ ).
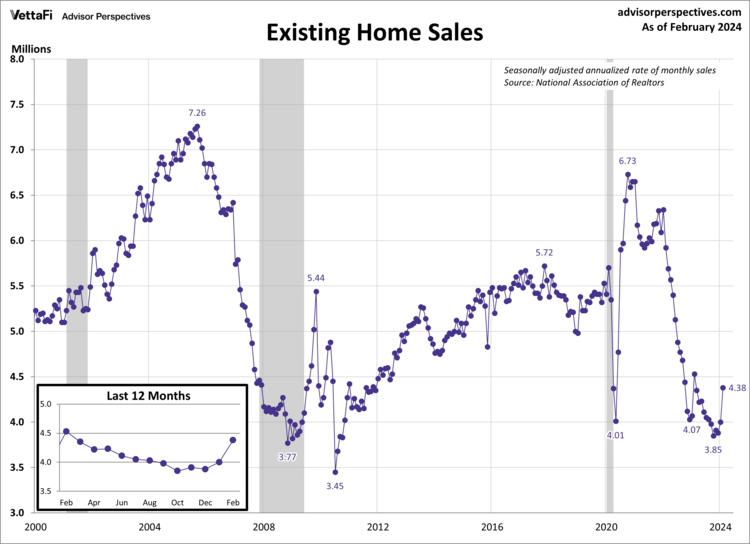
Economic Indicators: Existing Home Sales
Existing home sales jumped to their highest level in a year as additional housing supply helped satisfy strong buyer demand. In February, existing home sales rose 9.5% to a seasonally adjusted annual rate of 4.38 million units, marking the second consecutive monthly increase. This uptick potentially signals a turning point in existing home sales, which have been consistently declining over the past two years. The latest figure was higher than expected, with sales exceeding the projected 3.95 million units.
Strong buyer demand caused the price for an existing home to also climb higher in February. The median price for an existing home was $384,500 last month, a 1.6% increase from January. Additionally, compared to one year ago, the median price for an existing home was up 5.7%, marking the eighth consecutive month of annual increases.
Economic Indicators: Housing Starts
New home construction rebounded in February after unexpectedly falling in January. Housing starts surged 10.7% to a seasonally adjusted annual rate of 1.521 million units, well above the forecasted rate of 1.430 million units. This marked the largest monthly rise in housing starts in nine months and a 5.9% year-over-year increase.
A breakdown of the data revealed growth across the board, with both single- and multifamily units experiencing an increase in activity last month. Consumers, facing limited options in the resale market, have been turning their attention to new construction housing. This increased attention, coupled with slightly more favorable mortgage rates, should allow housing construction to remain strong for the year.

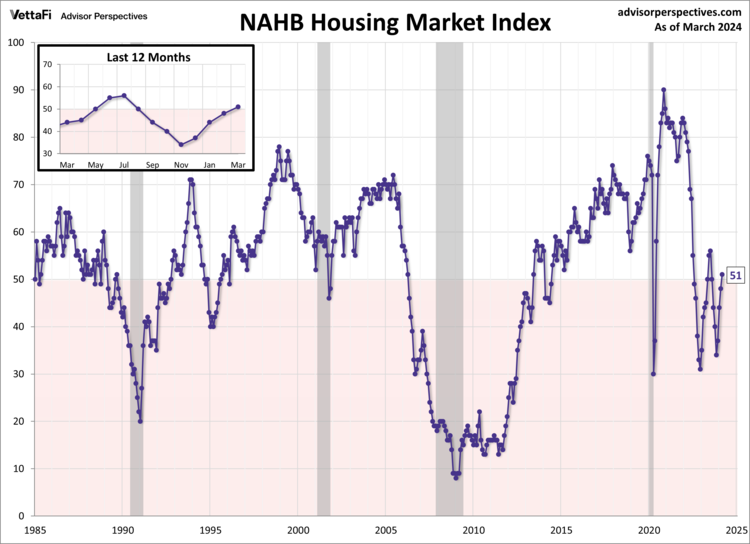
The increase in housing starts last month underscores the growing optimism among builders in recent months. The NAHB housing market index, which measures builder opinion on current and future home sales, rose for a fourth straight month to its highest level since July. Builders recognize strong buyer demand, combined with lack of existing home inventory and moderating mortgage rates, will lead to more homebuying in the months to come.
Economic Indicators: Building Permits
New residential building permits rose in February to their fastest pace in six months. Building permits play a pivotal role in gauging future construction activity, making them a crucial indicator of housing market demand. Last month, building permits increased by 1.9% compared to January, reaching a seasonally adjusted annual rate of 1.518 million units. The latest figure exceeded the anticipated rate of 1.500 million units. Building permits are up 2.4% compared to one year ago, marking the fourth consecutive month of year-over-year increases.

Big Picture
The housing indicators released this week all point to a housing market that is slowly heating back up and signaling growth for 2024. Builders are growing more confident, housing starts and building permits both rebounded from January, and existing home sales surged to a one-year high. While mortgage rates remain elevated, they are slowly declining from their 2023 highs, and future homebuyers may be settling in to a “new normal” of expectations.
The Week Ahead
The upcoming week will deliver some of the market’s most closely watched data that provides insight into economic growth, consumption, and consumer attitudes.
On Tuesday, the Conference Board will report the March reading for its Consumer Confidence Index. Consumer confidence, which could impact the Consumer Discretionary Select Sector SPDR ETF (XLY ), retreated last month as uncertainty about the U.S. economy remains persistent.
Then on Thursday, the Bureau of Economic Analysis (BEA) will release the final estimate of the 2023 Q4 GDP. As a reminder, last month the initial estimate was revised lower, from 3.3% to 3.2%.
Finally, on Friday, the BEA will publish February’s PCE price index data, the Fed’s preferred measure of inflation. Headline and core PCE have slowly trended downward toward the Fed’s 2% target rate over the past few years, with the latest readings at 2.4% and 2.8%, respectively.
For more news, information, and analysis, visit the Innovative ETFs Channel.

