

Last week all eyes were on the Jackson Hole symposium, as Fed Chair Jerome Powell’s speech delivered a dramatic reversal for financial markets. The S&P 500 fell for most of the week thanks to a major tech sell-off and further labor market weakness. But that all changed on Friday when Powell signaled the central bank is likely to begin cutting rates in September. This sent stocks soaring to their biggest daily gain in nearly three months, allowing the index to finish the week in the green. While the market was transfixed by this key event, other economic news from the week included a new record high for margin debt, rising unemployment claims, and an unexpected increase in existing home sales.
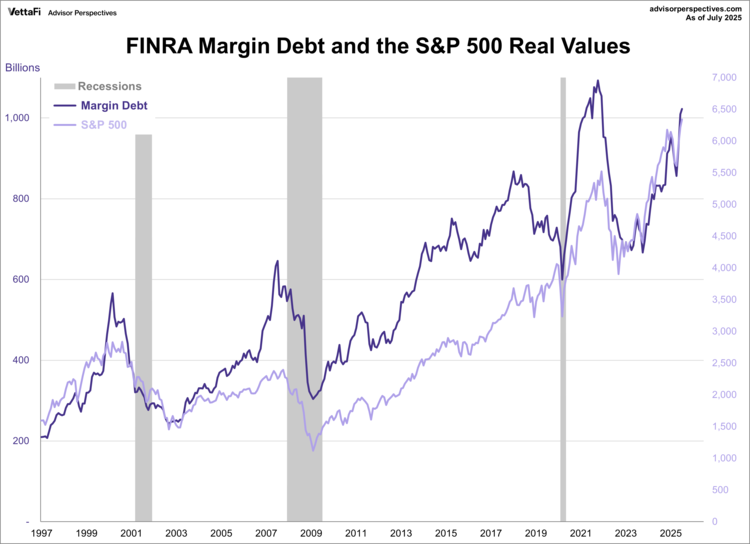
Margin Debt
In July, FINRA margin debt, which represents the amount of money investors borrow from their brokers, reached a new all-time high of $1.02 trillion. This marks the third consecutive monthly increase, up 1.5% from June and a substantial 26.1% higher than one year ago. When adjusted for inflation, however, the debt level is still 6.5% below its peak from nearly four years ago.
Margin debt is a key indicator of investor sentiment and risk appetite, as significant increases in borrowing often correlate with market peaks, while troughs in debt tend to precede market bottoms. While high levels of margin debt signal confidence, they also increase market instability. This is because forced selling can occur if stock prices drop, triggering a cascade effect.
Unemployment Claims
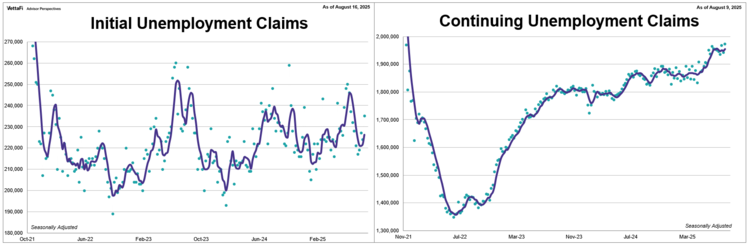
The number of people who filed for unemployment for the first time rose to its highest level in nearly two months. Initial jobless claims (IC) increased by 11,000 from the previous week to 235,000, the biggest weekly increase in nearly three months. The latest reading, with data through August 16th, was higher than the forecast of 226,000.
Meanwhile, the number of people who had already filed for unemployment and continued to claim benefits jumped to its highest level since November 2021. Continuing jobless claims (CC) rose by 30,000 from the previous week’s downwardly revised figure to 1.972 million. The latest reading, with data through August 9th, was above the forecast of 1.960 million.
Recently, the data from both series has suggested a “low fire yet low hire” environment where the pace of new layoffs isn’t accelerating dramatically but it is taking longer for laid-off workers to find new jobs. However, the latest jump in both IC and CC adds to the narrative of a weakening labor market. This is consistent with the softer July jobs report and prior-month revisions, indicating that layoffs may be picking up and the job market is cooling more than previously thought.
Existing Home Sales
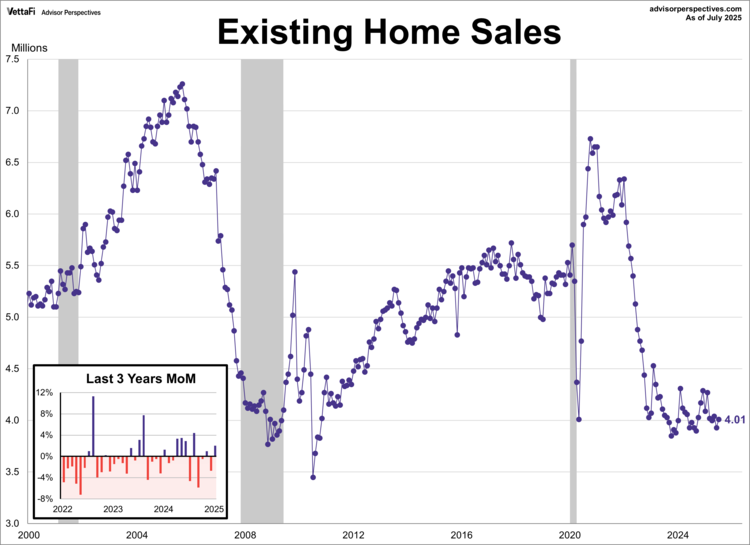
Existing home sales unexpectedly rose in July, increasing by 2.0% to a seasonally adjusted annual rate of 4.01 million units. This increase, which surpassed the forecast of 3.92 million, was likely influenced by a slight improvement in housing affordability, as the median home price fell for the first time in six months.
Housing affordability improved slightly in July, driven by a decline in both home prices and mortgage rates. The median price for an existing home dropped by 2.4% from June to $422,400, the first decline since January but still the fifth consecutive month above the $400,000 mark. Additionally, the average 30-year fixed mortgage rate edged down to 6.72% in July, from 6.82% in June. This slight reprieve helped boost sales. But prices were still up 0.2% compared to a year ago. That marks the 25th consecutive month of annual price increases.
Market Reactions
The S&P 500 ended its five-day losing streak on Friday after posting its largest daily gain in nearly three months. The index finished the week up 0.3%, its fifth weekly gain in the past six weeks. As a result, the SPDR S&P 500 ETF Trust SPY) rose 2.0%.
The 10-year Treasury yield finished the week at 4.26%, while the 2-year note finished at 3.68%.
The CME FedWatch Tool currently shows an 83% likelihood that the Fed will cut rates by 25 basis points at its meeting next month. Markets are pricing in another 25 basis point cut at the December meeting and three additional cuts in 2026.
Economic Data in the Week Ahead
The week ahead will provide more clues on the state of the economy. Several reports will shed light on growth, inflation, and consumer sentiment. On Thursday, the Bureau of Economic Analysis will release its second estimate for Q2 GDP. It will offer a revised look at economic growth. On Friday, the Department of Commerce’ will release of the PCE Price Index. That’s the Fed’s preferred measure of inflation. In addition, new reports on consumer confidence from the Conference Board and the University of Michigan will provide insights into consumer attitudes. Other data to be released includes reports on new and pending home sales. There will also be reports on durable goods orders and regional manufacturing surveys.
Originally appeared on Advisor Perspectives
For more news, information, and analysis, visit the Innovative ETFs Content Hub.

