

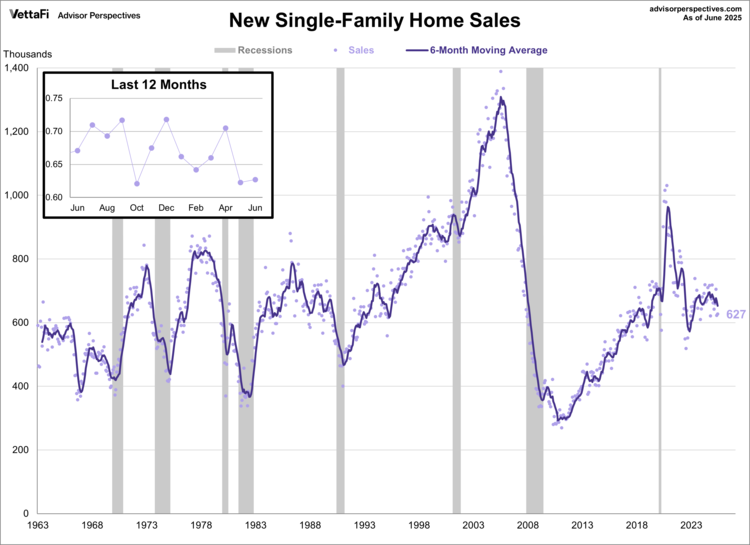
New home sales inched up in June but still came in lower than expected. According to the Census Bureau, new home sales were at a seasonally adjusted annual rate of 627,000 last month. This represents a 0.6% increase from May’s rate of 623,000 and a 6.6% decline from one year ago. The latest reading was lower than the forecast of 649,000.
For a long-term perspective, here is a snapshot of the series beginning in 1963. We’ve included a six-month moving average to highlight the trend in this highly volatile series.
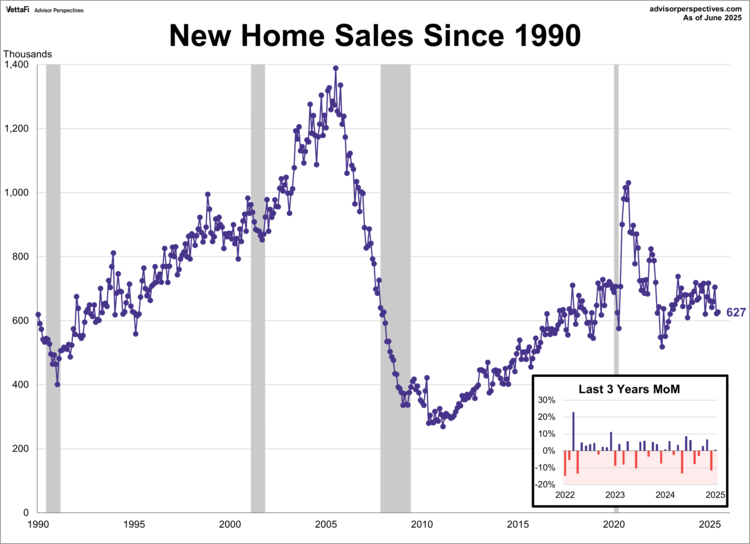
For a closer look, the next chart shows new home sales since 1990. Over this time frame, we see the steady rise in new home sales following the early ’90s recession and the acceleration in sales during the real estate bubble that peaked in 2005. Starting in 2011, there was a similar rise in new home sales that peaked near the end of 2020 and retracted for about two years. New home sales showed consistent growth at the start of 2023 but have been stagnant over the past couple of years.
New Home Sales: The Population-Adjusted Reality
Simply looking at raw new home sales figures can be misleading, as a growing population naturally suggests a higher number of sales. To gain a clearer picture of housing market strength relative to population growth, we need to normalize the data with a simple population adjustment. This adjustment—expressing new home sales as a percentage of the population—allows us to see the proportion of the population actively purchasing new homes, effectively accounting for the increase in potential buyers. This reveals whether housing demand is truly keeping pace with population growth.
The Census Bureau’s mid-month population estimates show a 81.9% increase in the U.S. population since 1963. Here is a chart of new home sales as a percentage of the population.
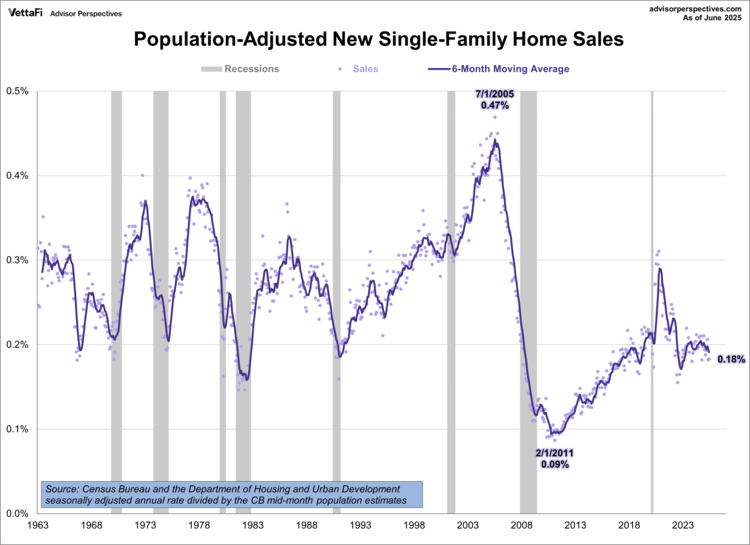
This adjusted data reveals key trends. A rising percentage indicates a healthy market with increased demand relative to population, while a declining percentage suggests a weakening market and reduced demand. New home sales as a percentage of the population peaked at 0.47% in July 2005, showing strong demand, and bottomed at 0.09% in February 2011, reflecting a severe downturn.
New single-family home sales are 6.1% above the 1963 start of this data series. However, the population-adjusted version is 41.7% below the first 1963 sales.
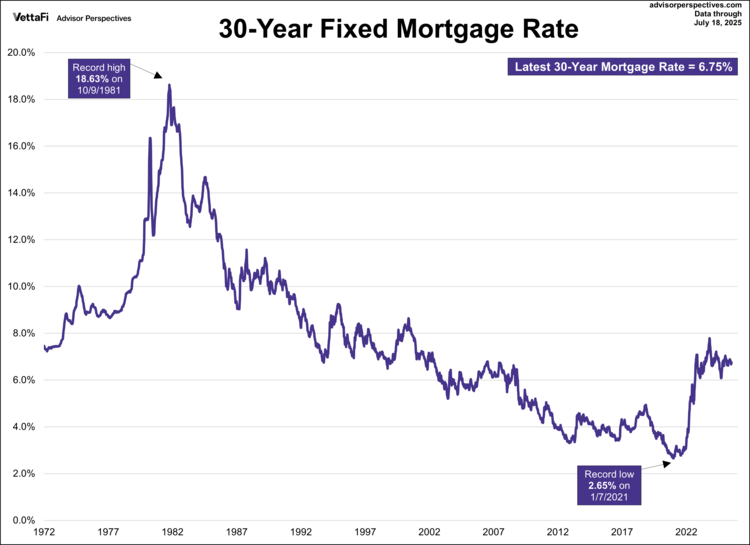
The 30-Year Fixed Rate Mortgage
According to Freddie Mac, the average 30-year fixed rate mortgage in June 2025 was 6.82%. Here is a look back at the 30-year fixed-rate mortgage weekly average, beginning in April 1971.
New Home Sales: Median Price
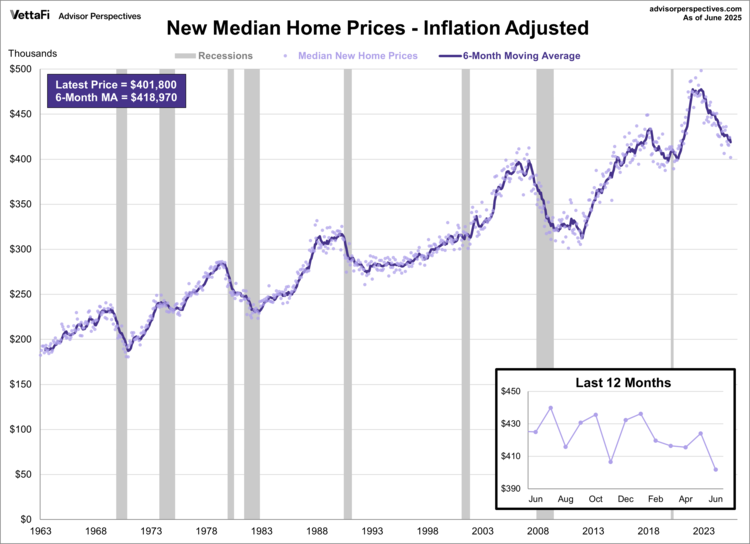
The median price for a new home remained above $400,000 for a seventh straight month, now at $401,800. This represents a 4.9% decrease from the previous month and a 3.0% decline from one year ago. However, after adjusting for inflation, the monthly change is at a 5.3% decrease while the annual change is at a 5.5% decline.
This next chart shows the inflation-adjusted median sales price of new homes since 1963, using the consumer price index for all urban consumers (CPI-U) for the inflation adjustment. We’ve included a six-month moving average to give us a clearer sense of the trend.
ETFs associated with residential real-estate include: iShares Residential and Multisector Real Estate ETF (REZ ).
ETFs associated with home builders include: Invesco Dynamic Building & Construction ETF (PKB ), iShares U.S. Home Construction ETF (ITB ) and SPDR S&P Homebuilders ETF (XHB ).
For additional perspectives on residential real estate, here is the complete list of our monthly updates:
- S&P/Case-Shiller Home Price Index
- FHFA House Price Index
- NAHB Housing Market Index
- Existing Home Sales
- New Residential Housing Starts
- New Residential Building Permits
- Pending Home Sales
Originally published Advisor Perspectives
For more news, information, and analysis, visit the Innovative ETFs Content Hub.

