

Economic indicators are released regularly to measure, track, and analyze the health and performance of the U.S. economy. Policymakers, advisors, and analysts closely monitor these indicators to gauge recession risk and understand the direction of interest rates. This is because the data can significantly impact business decisions and financial markets. In the week ending September 21, the SPDR S&P 500 ETF Trust (SPY ) experienced a 2.70% decline, while the Invesco S&P 500 Equal Weight ETF (RSP ) dropped 2.51%.
Last week, the U.S. housing market took center stage as the latest data on several housing-related indicators was unveiled. In this article, we examine a selection of these crucial housing indicators from the past week. These include existing home sales, housing starts, builder confidence, and building permits. Such interconnected indicators provide a comprehensive overview of the housing market, offering insights into both supply and demand dynamics, as well as market sentiment.
The housing indicators discussed in this article could impact home builders and residential real-estate ETFs such as the Invesco Dynamic Building & Construction ETF (PKB ), iShares U.S. Home Construction ETF (ITB ), SPDR S&P Homebuilders ETF (XHB ), and iShares Residential and Multisector Real Estate ETF (REZ ).
Existing Housing Market Sales
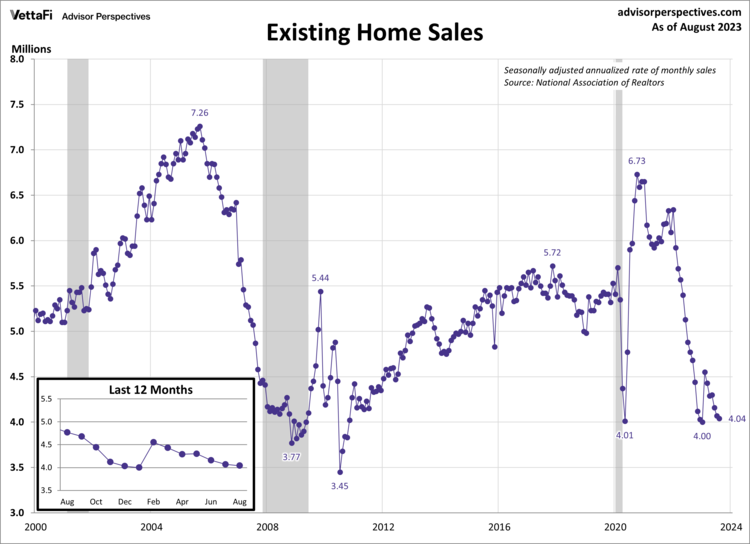
Rising mortgage rates and a lack of inventory in the housing market caused existing home sales to drop to their slowest pace since January. In August, existing home sales fell by 0.7%, reaching a seasonally adjusted annual rate of 4.04 million units. This decline marks the 17th drop in the past 19 months. This highlights the consistent downward trajectory in existing home sales over the last year and a half. The latest figure was lower than expected, with sales falling short of the projected 4.10 million units.
Despite this decline in sales volume, existing home prices climbed higher in August, primarily due to elevated mortgage rates. The median price for existing homes edged above $400,00 for the third consecutive month, settling at $407,100. Many current homeowners are holding onto their homes, benefiting from low mortgage rates secured years ago. This reluctance to sell has further constrained the inventory of existing homes, intensifying competition among buyers and driving prices higher.
Housing Market Starts
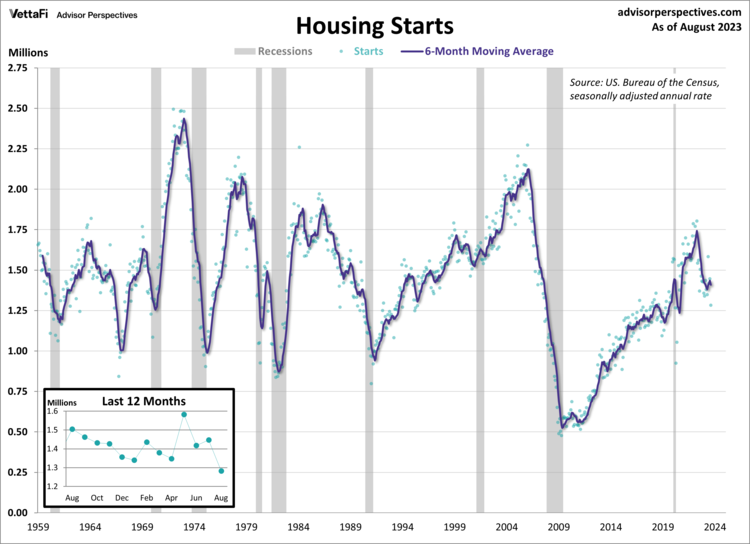
In August, new home construction experienced a significant downturn, plummeting to its slowest pace in over three years. Housing starts fell sharply by 11.3% to a seasonally adjusted annual rate of 1.283 million units, well below the anticipated pace of 1.440 million units. This marked the largest monthly decline in housing starts in over a year and a 14.8% year-over-year decrease. A breakdown of the data reveals declines across the board, with both single and multi-family units experiencing a decrease in construction activity last month. Consumers, facing limited options in the resale market, had been turning their attention to new construction housing in recent months. However, the rising mortgage rates and ongoing affordability issues have started to stifle the momentum seen over the last few months.
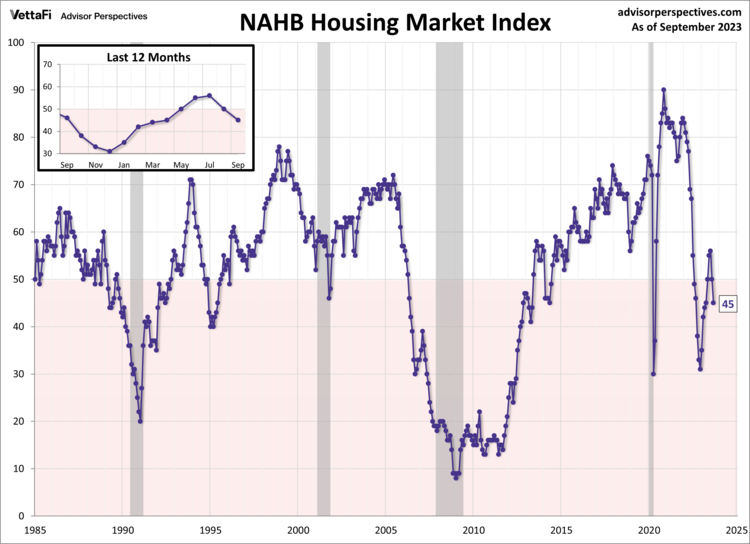
The decline in housing starts observed in August underscores the diminishing confidence among builders in recent months. The NAHB housing market index, which measures builder opinion on current and future home sales, fell for a second straight month to its lowest level since April. While the low levels of existing home inventory had previously provided some optimism for homebuilders, their outlook has grown increasingly pessimistic due to the persistent impact of elevated mortgage rates and housing affordability concerns on home buying.
Building Permits
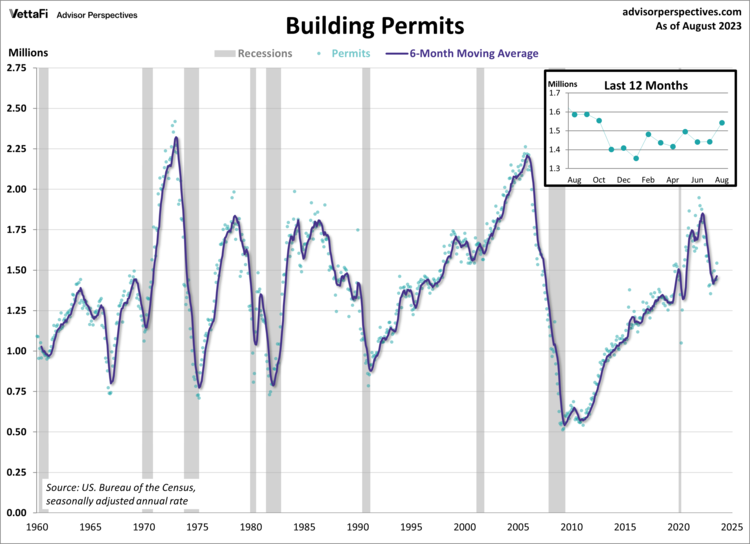
New residential building permits unexpectedly jumped in August to their fastest pace since October 2022. Building permits play a pivotal role in gauging future construction activity, making them a crucial indicator of housing market demand. Last month, building permits increased by 6.9% compared to July, reaching a seasonally adjusted annual rate of 1.543 million units. This figure exceeded market expectations, which had anticipated a more modest rate of 1.440 million units. However, building permits are down 2.7% compared to one year ago, marking the 13th consecutive month of year-over-year declines. Other housing indicators point to a cooling housing market and mortgage rates exceeding 7%. The unexpected surge in building permits last month suggests potential resilience in future housing activity.
Economic Indicators and the Week Ahead
In the coming week, keep an eye out for the eagerly awaited final estimate of the 2023 Q2 GDP, the August PCE price index data, and the September reading of the Conference Board’s Consumer Confidence Index®. These closely related indicators offer valuable insights into the nation’s economic climate, particularly in terms of consumption and consumer sentiment.
The 2023 Q2 final estimate is forecasted to come in at 2.2%, up from the 2023 Q1 final estimate of 2.0%. The core PCE price index, the Fed’s preferred measure of inflation, will be released on Friday where we’ll learn if inflation rose for a second consecutive month or if it resumed its slow downward trend that began early last year. Finally, consumer attitudes are expected to have slightly worsened from last month as the Conference Board’s Consumer Confidence Index®, which could impact the Consumer Discretionary Select Sector SPDR ETF (XLY ), is predicted to fall from 106.1 to 105.9.
For more news, information, and analysis, visit the Innovative ETFs Channel.

