

Editor’s note: Any and all references to time frames longer than one trading day are for purposes of market context only, and not recommendations of any holding time frame. Daily rebalancing ETFs are not meant to be held unmonitored for long periods. If you don’t have the resources, time or inclination to constantly monitor and manage your positions, leveraged and inverse ETFs are not for you.
Wall Street analysts are revising their outlook for Q3 2024 earnings, expecting a notable cooling for the S&P 500. Earnings per share (EPS)* for the index are forecasted to drop by 3.9%, marking a sharper-than-usual reduction.
A cooling outlook comes despite hopes that the Federal Reserve’s rate hikes may be stabilizing and that inflation* will soften, allowing growth sectors to regain momentum.
Key Sectors and Trends:
Information Technology:
- Positive Outlook: Amidst the cooling earnings environment, the information technology (IT) sector remains a bright spot. Analysts have actually revised EPS estimates upward by 0.3% during the quarter, signaling continued strength in tech.
- Key Players: Giants like Apple, Microsoft, and Nvidia have been pivotal in driving tech performance, buoyed by demand for AI and cloud computing.
Financials:
- Mixed Results: The financial sector has a varied outlook. While banks are expected to post a slight decline in earnings, other areas within the financial industry are forecasted to perform better.
- Big Banks on Deck: Major financial institutions such as JPMorgan Chase, Wells Fargo, and Citigroup will kick off the earnings season, providing crucial insight into the sector’s overall health.
Consumer Discretionary and Energy Sectors:
- These sectors are expected to underperform, reflecting weaker consumer demand and fluctuating energy prices. Higher interest rates may be affecting consumer behavior, leading to slower spending in discretionary areas, while energy prices remain volatile amid global uncertainties.
Economic Backdrop:
- Federal Reserve Policy: With rate hikes potentially pausing, there’s anticipation that inflation will stabilize, though challenges remain. The Fed’s actions continue to be a pivotal influence on market expectations.
- Market Sentiment: Despite slower growth projections, there’s still optimism about tech’s dominance and its potential to lift overall S&P 500 performance. A cautious approach prevails, especially with continued geopolitical uncertainties.
Upcoming Catalysts:
Earnings Season Start:
- Financials are the first to report, with JPMorgan and Wells Fargo expected to set the tone. Investors will closely monitor these results for guidance on future market direction.
Broader Market Impact:
- The Q3 earnings season will provide further insight into how well sectors have weathered the dual pressures of inflation and higher interest rates.
While the overall outlook is cautious, with many sectors cooling, tech remains a beacon of growth. The broader economic landscape, including interest rates and inflation, continues to shape expectations for both individual sectors and the market as a whole.
Here’s a list of announcement dates with related "Leveraged & Inverse ETFs,":https://www.direxion.com/leveraged-and-inverse-etfs week-by-week for 2024’s Q3 earnings season.
Earnings dates are subject to change without notice.
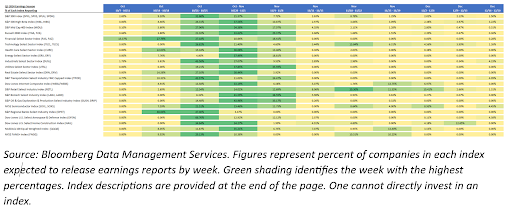
Q3 2024 Earnings Season – % of Each Index Reporting by Week
S&P 500 Index
S&P 500 High Beta Index
| Ticker | Name | Weight in the Index | Expected Earnings Release |
|---|---|---|---|
| SMCI UW | Super Micro Computer Inc | 1.97% | 11/1/2024 |
| AMD UW | Advanced Micro Devices Inc | 1.84% | 10/31/2024 |
| MPWR UW | Monolithic Power Systems Inc | 1.79% | 10/30/2024 |
| NVDA UW | NVIDIA Corp | 1.77% | 11/21/2024 |
| AVGO UW | Broadcom Inc | 1.61% | 12/6/2024 |
| TSLA UW | Tesla Inc | 1.55% | 10/23/2024 |
| BLDR UN | Builders FirstSource Inc | 1.52% | 11/1/2024 |
| TER UW | Teradyne Inc | 1.48% | 10/25/2024 |
| ANET UN | Arista Networks Inc | 1.41% | 10/30/2024 |
| ALB UN | Albemarle Corp | 1.41% | 11/1/2024 |
Financials Select Sector Index
Health Care Select Sector Index
| Ticker | Name | Weight in the Index | Expected Earnings Release |
|---|---|---|---|
| LLY UN | Eli Lilly & Co | 12.53% | 10/30/2024 |
| UNH UN | UnitedHealth Group Inc | 9.77% | 10/15/2024 |
| JNJ UN | Johnson & Johnson | 6.95% | 10/15/2024 |
| MRK UN | Merck & Co Inc | 5.05% | 10/31/2024 |
| TMO UN | Thermo Fisher Scientific Inc | 4.14% | 10/23/2024 |
| DHR UN | Danaher Corp | 3.12% | 10/22/2024 |
| AMGN UW | Amgen Inc | 3.07% | 10/30/2024 |
| ISRG UW | Intuitive Surgical Inc | 3.06% | 10/17/2024 |
| PFE UN | Pfizer Inc | 2.88% | 10/29/2024 |
| BSX UN | Boston Scientific Corp | 2.22% | 10/23/2024 |
Industrials Select Sector Index
| Ticker | Name | Weight in the Index | Expected Earnings Release |
|---|---|---|---|
| GE UN | General Electric Co | 4.89% | 10/22/2024 |
| CAT UN | Caterpillar Inc | 4.62% | 10/31/2024 |
| RTX UN | RTX Corp | 4.02% | 10/22/2024 |
| UBER UN | Uber Technologies Inc | 3.67% | 11/7/2024 |
| UNP UN | Union Pacific Corp | 3.56% | 10/24/2024 |
| HON UW | Honeywell International Inc | 3.20% | 10/24/2024 |
| ETN UN | Eaton Corp PLC | 3.16% | 10/31/2024 |
| LMT UN | Lockheed Martin Corp | 3.13% | 10/22/2024 |
| DE UN | Deere & Co | 2.56% | 11/21/2024 |
| UPS UN | United Parcel Service Inc | 2.34% | 10/24/2024 |
Real Estate Select Sector Index
| Ticker | Name | Weight in the Index | Expected Earnings Release |
|---|---|---|---|
| PLD UN | Prologis Inc | 10.15% | 10/16/2024 |
| EQIX UW | Equinix Inc | 7.46% | 10/25/2024 |
| WELL UN | Welltower Inc | 6.58% | 10/30/2024 |
| PSA UN | Public Storage | 4.97% | 10/30/2024 |
| O UN | Realty Income Corp | 4.83% | 11/4/2024 |
| SPG UN | Simon Property Group Inc | 4.58% | 10/30/2024 |
| CCI UN | Crown Castle Inc | 4.42% | 10/16/2024 |
| DLR UN | Digital Realty Trust Inc | 4.36% | 10/25/2024 |
| EXR UN | Extra Space Storage Inc | 3.34% | 10/29/2024 |
| CBRE UN | CBRE Group Inc | 3.33% | 10/24/2024 |
Dow Jones Internet Composite Index
| Ticker | Name | Weight in the Index | Expected Earnings Release |
|---|---|---|---|
| META UW | Meta Platforms Inc | 7.52% | 10/30/2024 |
| GOOGL UW | Alphabet Inc | 5.16% | 10/24/2024 |
| CRM UN | Salesforce Inc | 5.11% | 11/29/2024 |
| CSCO UW | Cisco Systems Inc | 5.07% | 11/15/2024 |
| NFLX UW | Netflix Inc | 4.91% | 10/17/2024 |
| GOOG UW | Alphabet Inc | 4.46% | 10/24/2024 |
| PYPL UW | PayPal Holdings Inc | 3.61% | 10/29/2024 |
| SNOW UN | Snowflake Inc | 3.00% | 11/29/2024 |
| WDAY UW | Workday Inc | 2.93% | 11/29/2024 |
| ANET UN | Arista Networks Inc | 2.56% | 10/30/2024 |
S&P Biotechnology Select Industry Index
| Ticker | Name | Weight in the Index | Expected Earnings Release |
|---|---|---|---|
| INCY UW | Incyte Corp | 2.73% | 10/31/2024 |
| UTHR UW | United Therapeutics Corp | 2.69% | 11/1/2024 |
| ALNY UW | Alnylam Pharmaceuticals Inc | 2.63% | 11/1/2024 |
| NTRA UW | Natera Inc | 2.63% | 11/8/2024 |
| GILD UW | Gilead Sciences Inc | 2.62% | 11/7/2024 |
| EXAS UR | Exact Sciences Corp | 2.62% | 11/1/2024 |
| VKTX UR | Viking Therapeutics Inc | 2.53% | 10/25/2024 |
| INSM UW | Insmed Inc | 2.52% | 10/25/2024 |
| SRPT UW | Sarepta Therapeutics Inc | 2.49% | 11/1/2024 |
| AMGN UW | Amgen Inc | 2.46% | 10/30/2024 |
NYSE Semiconductor Index
| Ticker | Name | Weight in the Index | Expected Earnings Release |
|---|---|---|---|
| AVGO UW | Broadcom Inc | 8.93% | 12/6/2024 |
| NVDA UW | NVIDIA Corp | 8.64% | 11/21/2024 |
| QCOM UW | QUALCOMM Inc | 6.29% | 11/6/2024 |
| TXN UW | Texas Instruments Inc | 6.21% | 10/22/2024 |
| MU UW | Micron Technology Inc | 4.45% | 12/20/2024 |
| INTC UW | Intel Corp | 4.28% | 10/25/2024 |
| MPWR UW | Monolithic Power Systems Inc | 4.13% | 10/30/2024 |
| TSM UN | Taiwan Semiconductor Manufacturing Co Ltd | 4.04% | 10/17/2024 |
| LRCX US | Lam Research Corp | 4.02% | 10/23/2024 |
| MRVL UW | Marvell Technology Inc | 4.00% | 11/29/2024 |
Dow Jones U.S. Select Home Construction Index
| Ticker | Name | Weight in the Index | Expected Earnings Release |
|---|---|---|---|
| DHI UN | DR Horton Inc | 14.77% | 10/29/2024 |
| LEN UN | Lennar Corp | 11.97% | 12/13/2024 |
| NVR UN | NVR Inc | 7.90% | 10/24/2024 |
| PHM UN | PulteGroup Inc | 7.88% | 10/22/2024 |
| HD UN | Home Depot Inc/The | 4.66% | 11/12/2024 |
| LOW UN | Lowe's Cos Inc | 4.60% | 11/19/2024 |
| SHW UN | Sherwin-Williams Co/The | 4.26% | 10/24/2024 |
| TOL UN | Toll Brothers Inc | 4.18% | 12/5/2024 |
| BLD UN | TopBuild Corp | 3.18% | 10/31/2024 |
| BLDR UN | Builders FirstSource Inc | 3.06% | 11/1/2024 |
NASDAQ 100 Equal Weighted Index
| Ticker | Name | Weight in the Index | Expected Earnings Release |
|---|---|---|---|
| META UW | Meta Platforms Inc | 10.62% | 10/30/2024 |
| NFLX UW | Netflix Inc | 8.05% | 10/17/2024 |
| CRM UN | Salesforce Inc | 7.16% | 11/29/2024 |
| GOOGL UW | Alphabet Inc | 5.65% | 10/24/2024 |
| ANET UN | Arista Networks Inc | 4.87% | 10/30/2024 |
| GOOG UW | Alphabet Inc | 4.67% | 10/24/2024 |
| BKNG UW | Booking Holdings Inc | 4.56% | 10/30/2024 |
| CSCO UW | Cisco Systems Inc | 4.55% | 11/15/2024 |
| PYPL UW | PayPal Holdings Inc | 4.28% | 10/29/2024 |
| WDAY UW | Workday Inc | 2.74% | 11/29/2024 |
S&P Mid Cap 400® Index
| Ticker | Name | Weight in the Index | Expected Earnings Release |
|---|---|---|---|
| ILMN UW | Illumina Inc | 0.75% | 11/8/2024 |
| CSL UN | Carlisle Cos Inc | 0.72% | 10/25/2024 |
| EME UN | EMCOR Group Inc | 0.70% | 10/25/2024 |
| WSM UN | Williams-Sonoma Inc | 0.68% | 11/15/2024 |
| LII UN | Lennox International Inc | 0.66% | 10/25/2024 |
| TPL UN | Texas Pacific Land Corp | 0.62% | 11/1/2024 |
| EXE UW | Expand Energy Corp | 0.60% | 10/31/2024 |
| AVTR UN | Avantor Inc | 0.60% | 10/25/2024 |
| MANH UW | Manhattan Associates Inc | 0.59% | 10/24/2024 |
| WSO UN | Watsco Inc | 0.59% | 10/18/2024 |
Russell 2000® Index
| Ticker | Name | Weight in the Index | Expected Earnings Release |
|---|---|---|---|
| FTAI UW | FTAI Aviation Ltd | 0.52% | 10/25/2024 |
| PCVX UW | Vaxcyte Inc | 0.52% | 11/6/2024 |
| INSM UW | Insmed Inc | 0.44% | 10/25/2024 |
| SFM UW | Sprouts Farmers Market Inc | 0.43% | 10/30/2024 |
| FN UN | Fabrinet | 0.33% | 11/6/2024 |
| AIT UN | Applied Industrial Technologies Inc | 0.33% | 10/25/2024 |
| FLR UN | Fluor Corp | 0.32% | 11/4/2024 |
| ENSG UW | Ensign Group Inc/The | 0.31% | 10/25/2024 |
| MLI UN | Mueller Industries Inc | 0.31% | 10/24/2024 |
| UFPI UW | UFP Industries Inc | 0.30% | 10/31/2024 |
Technology Select Sector Index
| Ticker | Name | Weight in the Index | Expected Earnings Release |
|---|---|---|---|
| MSFT UW | Microsoft Corp | 13.32% | 10/24/2024 |
| NVDA UW | NVIDIA Corp | 12.96% | 11/21/2024 |
| AVGO UW | Broadcom Inc | 4.56% | 12/6/2024 |
| CRM UN | Salesforce Inc | 3.03% | 11/29/2024 |
| AMD UW | Advanced Micro Devices Inc | 2.99% | 10/31/2024 |
| ORCL UN | Oracle Corp | 2.99% | 12/11/2024 |
| CSCO UW | Cisco Systems Inc | 2.37% | 11/15/2024 |
| IBM UN | International Business Machines Corp | 2.28% | 10/23/2024 |
| QCOM UW | QUALCOMM Inc | 2.09% | 11/6/2024 |
| TXN UW | Texas Instruments Inc | 2.07% | 10/22/2024 |
Energy Select Sector Index
| Ticker | Name | Weight in the Index | Expected Earnings Release |
|---|---|---|---|
| XOM UN | Exxon Mobil Corp | 23.44% | 10/28/2024 |
| CVX UN | Chevron Corp | 15.34% | 11/1/2024 |
| SLB UN | Schlumberger NV | 4.55% | 10/18/2024 |
| EOG UN | EOG Resources Inc | 4.51% | 11/7/2024 |
| WMB UN | Williams Cos Inc/The | 4.22% | 11/1/2024 |
| PSX UN | Phillips 66 | 4.10% | 10/29/2024 |
| MPC UN | Marathon Petroleum Corp | 4.04% | 11/5/2024 |
| OKE UN | ONEOK Inc | 3.96% | 10/29/2024 |
| KMI UN | Kinder Morgan Inc | 3.21% | 10/18/2024 |
| VLO UN | Valero Energy Corp | 3.21% | 10/24/2024 |
Utilities Select Sector Index
| Ticker | Name | Weight in the Index | Expected Earnings Release |
|---|---|---|---|
| NEE UN | NextEra Energy Inc | 14.13% | 10/24/2024 |
| SO UN | Southern Co/The | 8.02% | 11/1/2024 |
| DUK UN | Duke Energy Corp | 7.20% | 11/7/2024 |
| CEG UW | Constellation Energy Corp | 6.92% | 11/6/2024 |
| SRE UN | Sempra | 4.21% | 11/4/2024 |
| D UN | Dominion Energy Inc | 3.93% | 11/4/2024 |
| PEG UN | Public Service Enterprise Group Inc | 3.67% | 10/31/2024 |
| VST UN | Vistra Corp | 3.66% | 11/7/2024 |
| PCG UN | PG&E Corp | 3.37% | 11/7/2024 |
| EXC UW | Exelon Corp | 3.28% | 10/30/2024 |
S&P Transportation Select Industry FMC Capped Index
| Ticker | Name | Weight in the Index | Expected Earnings Release |
|---|---|---|---|
| UBER UN | Uber Technologies Inc | 18.10% | 11/7/2024 |
| UNP UN | Union Pacific Corp | 17.53% | 10/24/2024 |
| UPS UN | United Parcel Service Inc | 8.75% | 10/24/2024 |
| DAL UN | Delta Air Lines Inc | 4.77% | 10/10/2024 |
| ODFL UW | Old Dominion Freight Line Inc | 4.50% | 10/23/2024 |
| CSX UW | CSX Corp | 4.49% | 10/16/2024 |
| NSC UN | Norfolk Southern Corp | 4.24% | 10/25/2024 |
| FDX UN | FedEx Corp | 4.09% | 12/19/2024 |
| UAL UW | United Airlines Holdings Inc | 3.27% | 10/15/2024 |
| LUV UN | Southwest Airlines Co | 3.24% | 10/24/2024 |
S&P Retail Select Industry Index
| Ticker | Name | Weight in the Index | Expected Earnings Release |
|---|---|---|---|
| CVNA UN | Carvana Co | 1.72% | 11/1/2024 |
| AEO UN | American Eagle Outfitters Inc | 1.51% | 11/21/2024 |
| SFM UW | Sprouts Farmers Market Inc | 1.51% | 10/30/2024 |
| MNRO UW | Monro Inc | 1.50% | 10/25/2024 |
| LAD UN | Lithia Motors Inc | 1.49% | 10/25/2024 |
| BBWI UN | Bath & Body Works Inc | 1.48% | 11/15/2024 |
| BOOT UN | Boot Barn Holdings Inc | 1.47% | 11/1/2024 |
| BJ UN | BJ's Wholesale Club Holdings Inc | 1.45% | 11/18/2024 |
| TSCO UW | Tractor Supply Co | 1.45% | 10/25/2024 |
| DDS UN | Dillard's Inc | 1.44% | 11/8/2024 |
S&P Oil & Gas Exploration & Production Select Industry Index
| Ticker | Name | Weight in the Index | Expected Earnings Release |
|---|---|---|---|
| CNX UN | CNX Resources Corp | 3.06% | 10/25/2024 |
| TPL UN | Texas Pacific Land Corp | 2.93% | 11/1/2024 |
| EXE UW | Expand Energy Corp | 2.87% | 10/31/2024 |
| EQT UN | EQT Corp | 2.81% | 10/25/2024 |
| SM UN | SM Energy Co | 2.77% | 11/1/2024 |
| XOM UN | Exxon Mobil Corp | 2.76% | 10/28/2024 |
| HES UN | Hess Corp | 2.75% | 10/30/2024 |
| RRC UN | Range Resources Corp | 2.74% | 10/23/2024 |
| OVV UN | Ovintiv Inc | 2.73% | 11/7/2024 |
| MRO UN | Marathon Oil Corp | 2.72% | 11/1/2024 |
S&P Regional Banks Select Industry Index
| Ticker | Name | Weight in the Index | Expected Earnings Release |
|---|---|---|---|
| RF UN | Regions Financial Corp | 4.84% | 10/18/2024 |
| MTB UN | M&T Bank Corp | 4.82% | 10/17/2024 |
| CFG UN | Citizens Financial Group Inc | 4.69% | 10/16/2024 |
| TFC UN | Truist Financial Corp | 4.69% | 10/17/2024 |
| HBAN UW | Huntington Bancshares Inc/OH | 4.66% | 10/17/2024 |
| FHN UN | First Horizon Corp | 3.51% | 10/16/2024 |
| ZION UW | Zions Bancorp NA | 2.86% | 10/21/2024 |
| WAL UN | Western Alliance Bancorp | 2.51% | 10/18/2024 |
| OZK UW | Bank OZK | 2.37% | 10/17/2024 |
| WBS UN | Webster Financial Corp | 2.15% | 10/23/2024 |
Dow Jones U.S. Select Aerospace & Defense Index
| Ticker | Name | Weight in the Index | Expected Earnings Release |
|---|---|---|---|
| GE UN | General Electric Co | 18.83% | 10/22/2024 |
| RTX UN | RTX Corp | 15.49% | 10/22/2024 |
| LMT UN | Lockheed Martin Corp | 11.24% | 10/22/2024 |
| AXON UW | Axon Enterprise Inc | 4.74% | 11/7/2024 |
| TDG UN | TransDigm Group Inc | 4.57% | 11/8/2024 |
| HWM UN | Howmet Aerospace Inc | 4.55% | 11/1/2024 |
| LHX UN | L3Harris Technologies Inc | 4.54% | 10/24/2024 |
| NOC UN | Northrop Grumman Corp | 4.43% | 10/24/2024 |
| GD UN | General Dynamics Corp | 4.29% | 10/25/2024 |
| BA UN | Boeing Co/The | 3.96% | 10/23/2024 |
NYSE FANG+ Index
| Ticker | Name | Weight in the Index | Expected Earnings Release |
|---|---|---|---|
| NVDA UW | NVIDIA Corp | 10.51% | 11/21/2024 |
| META UW | Meta Platforms Inc | 10.38% | 10/30/2024 |
| CRWD UW | Crowdstrike Holdings Inc | 10.25% | 11/29/2024 |
| GOOGL UW | Alphabet Inc | 10.03% | 10/24/2024 |
| NFLX UW | Netflix Inc | 9.92% | 10/17/2024 |
| NOW UN | ServiceNow Inc | 9.69% | 10/23/2024 |
| MSFT UW | Microsoft Corp | 9.41% | 10/24/2024 |
*Definitions and Index Descriptions
For more news, information, and analysis, visit the Leveraged & Inverse Channel.
Index Descriptions
- S&P 500® Index (SPXT) - Standard & Poor’s® selects the stocks comprising the S&P 500® Index (SPXT) on the basis of market capitalization, financial viability of the company and the public float, liquidity and price of a company’s shares outstanding. The Index is a float-adjusted, market capitalization-weighted index.
- S&P 500® High Beta Index (SP5HBIT) - Provided by S&P Dow Jones Indices (the “Index Provider”), which selects 100 securities to include in the Index from the S&P 500® Index that have the highest sensitivity to market movements, or “beta” over the past 12 months as determined by the Index Provider. Securities with the highest beta are generally the most volatile securities of the S&P 500® Index.
- Financial Select Sector Index (IXMTR) - Provided by S&P Dow Jones Indices and includes securities of companies from the following industries: Banks; Thrifts & Mortgage Finance; Diversified Financial Services; Consumer Finance; Capital Markets; Insurance; and Mortgage Real Estate Investment Trusts (REITs).
- Health Care Select Sector Index (IXVTR) - Provided by Standard & Poor’s and includes domestic companies from the healthcare sector, which includes the following industries: pharmaceuticals; health care equipment and supplies; health care providers and services; biotechnology; life sciences tools and services; and health care technology.
- Industrials Select Sector Index (IXITR) - Provided by S&P Dow Jones Indices and includes domestic companies from the industrials sector which includes the following industries: aerospace and defense; industrial conglomerates; marine; transportation infrastructure; machinery; road and rail; air freight and logistics; commercial services and supplies; professional services; electrical equipment; construction and engineering; trading companies and distributors; airlines; and building products.
- Real Estate Select Sector Index (IXRETR) - Provided by S&P Dow Jones Indices (the “Index Provider”) and includes securities of companies from the following industries: real estate management and development and real estate investment trusts (“REITs”), excluding mortgage REITs.
- Dow Jones Internet Composite Index (DJINETT) - Provided by S&P Dow Jones Indices and includes companies that generate at least 50% of their annual sales/revenue from the internet as determined by the Index Provider. Additionally, each stock must have a minimum of three months’ trading history and a three month average market capitalization of at least $100 million. The Index consists of 40 stocks from two different sectors, internet commerce and internet services
- S&P Biotechnology Select Industry Index (SPSIBITR) - Provided by S&P Dow Jones Indices LLC and includes domestic companies from the biotechnology industry. The Index is a modified equal – weighted index that is designed to measure the performance of the biotechnology sub-industry based on the Global Industry Classification Standards (GICS).
- NYSE Semiconductor Index (ICESEMIT) - A rules-based, modified float-adjusted market capitalization-weighted index that tracks the performance of the thirty largest U.S. listed semiconductor companies.
- Dow Jones U.S. Select Home Construction Index (DJSHMBT) - Measures U.S companies in the home construction sector that provide a wide range of products and services related to homebuilding, including home construction and producers, sellers and suppliers of building materials, furnishings and fixtures and also home improvement retailers. The Index may include large-, mid- or small-capitalization companies.
- NASDAQ 100® Equal Weighted Index (NETR) - Includes 100 of the largest non-financial securities listed on NASDAQ®, but instead of being weighted by market capitalization, each of the constituents is initially set at 1.00%.
- S&P Mid Cap 400® Index (SPTRMDCP) - Measures the performance of 400 mid-sized companies in the United States. The Index is a free-float adjusted market capitalization-weighted index composed of liquid common stocks.
- Russell 2000® Index (RU20INTR) - Measures the performance of approximately 2,000 small-capitalization companies in the Russell 3000® Index, based on a combination of their market capitalization.
- Technology Select Sector Index (IXTTR) - Provided by S&P Dow Jones Indices and includes domestic companies from the technology sector which includes the following industries: computers and peripherals; software; diversified telecommunications services; communications equipment; semiconductors and semi-conductor equipment; internet software and services; IT services; electronic equipment, instruments and components; wireless telecommunication services; and office electronics.
- Energy Select Sector Index (IXETR) - Provided by S&P Dow Jones Indices and includes domestic companies from the energy sector which includes the following industries: oil, gas and consumable fuels; and energy equipment and services.
- Utilities Select Sector Index (IXUTR) - Provided by S&P Dow Jones Indices and includes domestic companies from the utilities sector which includes the following industries: electric utilities; multi-utilities; water utilities; independent power producers and energy trades; and gas utilities.
- S&P Transportation Select Industry FMC Capped Index (SPTSCUT) - Provided by S&P Dow Jones Indices and is designed to measure stocks in the S&P Total Market Index that are included in the GICS transportation sub-industry.
- S&P Retail Select Industry Index (SPSIRETR) - A modified equal-weighted index that is designed to measure performance of the stocks comprising the S&P Total Market Index that are classified in the Global Industry Classification Standard (GICS) retail sub-industry.
- S&P Oil & Gas Exploration & Production Select Industry Index (SPSIOPTR) - Provided by Standard & Poor’s Index Provider and includes domestic companies from the oil and gas exploration and production sub industry. The Index is a modified equal weighted index that is designed to measure the performance of a sub industry or group of sub industries determined based on the Global Industry Classification Standards (GICS).
- S&P Regional Banks Select Industry Index (SPSIRBKT) - A modified equal-weighted index that is designed to measure performance of the stocks comprising the S&P Total Market Index that are classified in the Global Industry Classification Standard (GICS) regional banks sub-industry.
- Dow Jones U.S. Select Aerospace & Defense Index (DJSASDT) - Provided by Dow Jones U.S. Index (the “Index Provider”). The Index attempts to measure the performance of the aerospace and defense industry of the U.S. equity market. The Index Provider selects the stocks comprising the Index from the aerospace and defense sector on the basis of the float-adjusted, market capitalization-weight of each constituent. Aerospace companies include manufacturers, assemblers and distributors of aircraft and aircraft parts. Defense companies include producers of components and equipment for the defense industry, such as military aircraft, radar equipment and weapons.
- NYSE FANG+ Index (NYFANGT) - An equal-dollar weighted Index designed to track the performance of 10 highly-traded growth stocks of technology and tech-enabled companies. The Index is comprised of the securities of U.S.-listed companies that ICE Data Indices, LLC (the “Index Provider”) has identified as FANG+ companies, which are comprised of the six FAANMG companies and four non-FAANMG companies. The Index Provider defines the FAANMG as Meta Platforms Inc. (META), Apple Inc. (AAPL), Amazon.com Inc. (AMZN), Netflix Inc. (NFLX), Microsoft Corp. (MSFT), and Alphabet Inc. Class A (GOOGL). The Index is reconstituted quarterly.
An investor should carefully consider a Fund’s investment objective, risks, charges, and expenses before investing. A Fund’s prospectus and summary prospectus contain this and other information about the Direxion Shares. Click here to obtain a Fund’s prospectus and summary prospectus or call 866-476-7523. A Fund’s prospectus and summary prospectus should be read carefully before investing.
Leveraged and Inverse ETFs pursue daily leveraged investment objectives which means they are riskier than alternatives which do not use leverage. They seek daily goals and should not be expected to track the underlying index over periods longer than one day. They are not suitable for all investors and should be utilized only by sophisticated investors who understand leverage risk and who actively manage their investments.
Direxion Funds Risks — An investment in the Funds involves risk, including the possible loss of principal. The Funds are non-diversified and include risks associated with concentration risk which results from the Funds’ investments in a particular industry or sector and can increase volatility over time. Active and frequent trading associated with a regular rebalance of a fund can cause the price to fluctuate, therefore impacting its performance compared to other investment vehicles. For other risks including correlation, compounding, market volatility and risks specific to an industry or sector, please read the prospectus.
Direxion Shares ETF Risks — An investment in the ETFs involves risk, including the possible loss of principal. The ETFs are non-diversified and include risks associated with concentration that results from an ETF’s investments in a particular industry, sector or company, which can increase volatility. The leveraged and inverse ETF utilize derivatives, such as futures contracts and swaps which are subject to market risks that may cause their price to fluctuate over time. The leveraged and inverse ETFs do not attempt to, and should not be expected to, provide returns which are a multiple of the return of their respective index or underlying security for periods other than a single day. The leveraged and inverse ETFs may also subject to leverage, correlation, daily compounding, market volatility and risks specific to an industry, sector or company. The non-leveraged ETFs are subject to certain risks, including imperfect index correlation and market price variance, which may decrease performance. The non-leveraged ETFs may invest in a relatively small number of issuers and, as a result, be subject to greater risk of loss with respect to its portfolio securities. The non-leveraged ETFs may experience greater fluctuation in its net asset value as compared to other investments. The non-leveraged ETFs may be appropriate for investors with a long-term investment time horizon, who primarily seek capital growth, and who are able to tolerate periods of prolonged price declines. Please read each ETF’s prospectus for a more complete description of the investment risks. There is no guarantee that an ETF will achieve its investment objective.
Hong Kong Investors — This website and the investment products referenced herein (“Website”) are directed to persons who are “Professional Investors” within the meaning of the Hong Kong Securities and Futures Ordinance (Cap. 571) (“Ordinance”). This Website is not directed to the general public in Hong Kong. You agree that your use of this Website is subject to you reviewing and acknowledging the terms of this disclaimer and the website’s terms of use. Information herein is not intended for Professional Investors in any jurisdiction in which distribution or purchase is not authorized. This Website does not provide investment advice or recommendations, nor is it an offer or solicitation of any kind to buy or sell any investment products. Direxion Asia Limited (“DAL”) is licensed with and regulated by the Securities Futures Commission of Hong Kong (“SFC”) (CE Number: BAZ386) to provide services to Professional Investors. DAL does not maintain nor is it responsible for the contents of this Website, which has not been approved by the SFC. DAL is an affiliate of other companies within the Direxion Group companies which may manage the products and provide the services described herein, which are not directed to the general public in Hong Kong. Companies within the Direxion Group which do not carry out regulated activities in Hong Kong are not subject to the provisions of the Ordinance. ALPS Distributors, Inc. is the distributor for the Direxion Shares in the United States only.
Distributor: ALPS Distributors, Inc.

