
By Direxion
It’s that time of year again. The old adage “Sell in May and go away.”, commonly used by technical traders touts that traders should sell their stocks in May to avoid a seasonal market decline and buy them back sometime in the Fall. It’s important to make a distinction that traders are not always long-term investors. Many traders are looking for short-term action with high levels of volume. Let’s explore the opportunities.
Investors looking at this chart for the S&P 500 may conclude that U.S. stocks are due for another correction. As the most hated bull market in history continues, ten years after the Global Financial Crisis, most anyone you talk to thinks the odds may favor some level of pullback to come. But as with any uncertainty, for traders there’s opportunity and plenty of choices.
S&P 500 Index (4/1/1997 – 4/1/2019)
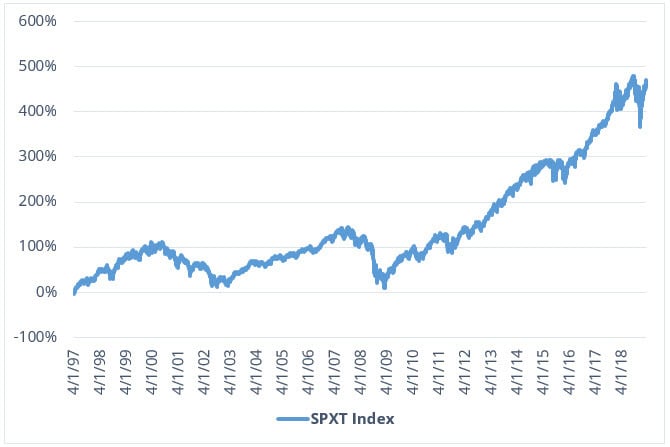
Source: Bloomberg. Past performance is not indicative of future results. One cannot invest directly in an index.
Instead of going away, some traders may choose to focus on sectors that may be less affected by the seasonal slow growth in the markets during the summer, such as healthcare or technology.
Healthcare stocks have sold off as of late, an effect of a broad market rotation favoring other groups, as well as from uncertainty in public policy. But positive earnings reports in the coming weeks could cause a spike in returns for the Health Care Select Sector Index, along with the Direxion Daily Healthcare Bull 3X Shares ETF (CURE ). Johnson & Johnson advanced on Tuesday 4/16, after it beat Q1 earnings expectations, even with pending litigation over allegations of that its baby powder contained asbestos, and it battles increased competition for prostate cancer drug Zytiga, from generics. Shares of UnitedHealth Group, the country’s largest health insurance company, were up 2.4 percent on the same day, after beating first-quarter earnings forecasts and raising its estimates for the full year, despite proposals from Democrats on nationalizing the health care system, under a “Medicare for All” plan.

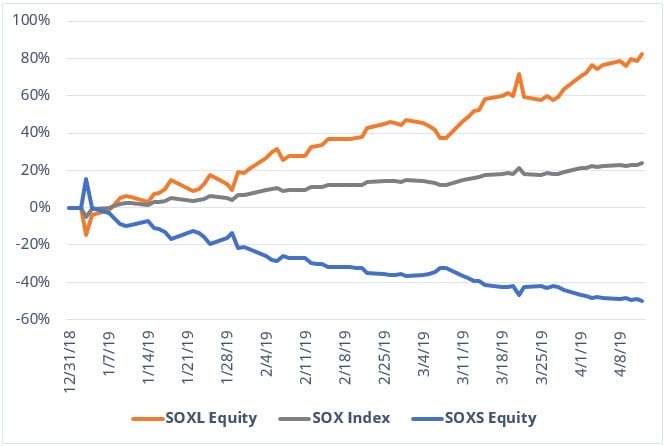
Source: Bloomberg. Date: 12/31/2018 – 4/12/2019. Past performance is not indicative of future results. Investment return and principal value of an investment will fluctuate so that an investor’s shares, when redeemed, may be worth more or less than their original cost. Current performance may be lower or higher than the performance data quoted. For standardized performance and the most recent month-end performance, click here
In the previous earnings quarter, the upside surprise throughout Information Technology names was notable, but it was the lowest over the last 8 reporting seasons. Microsoft has been one of the best-performing stocks of 2019, returning nearly 20%. Analysts are nearly unanimous in predicting that the stock is likely to continue to the upside following the earnings call on April 24th.
Apple, along with the rest of the FAANG stocks, has had big gains so far in 2019. The magnitude of the tech giant’s comeback is somewhat an effect of its enormous selloff at the end of 2018, on top of the prospects for the company’s services business. Those services include the company’s long-awaited streaming TV platform that’s being built to compete with Amazon, Netflix, Hulu, and Disney.
Microsoft and Apple combined, make up over 35% of the Technology Select Sector Index, the underlying index for the Direxion Daily Technology Bull 3X Shares ETF (TECL ) and Direxion Daily Technology Bear 3X Shares ETF (TECS ). So no matter what tech earnings season brings, traders have a way to stay nimble this Spring.
Source: Bloomberg. Date: 12/31/2018 – 4/12/2019. Past performance is not indicative of future results. Investment return and principal value of an investment will fluctuate so that an investor’s shares, when redeemed, may be worth more or less than their original cost. Current performance may be lower or higher than the performance data quoted. For standardized performance and the most recent month-end performance, click here.
Of course, depending on which side of the fence you’re on for any sector or subsector, if you’re a trader you have choices. Sell in May or don’t go away. And if you’re more cautious than optimistic, there’s another option – Hedge away, with Direxion Inverse or Leveraged Inverse ETFs.
Direxion’s Leveraged and Inverse ETFs allow you to express your opinion in a way that’s athletic and flexible. Find out more.
Related Leveraged ETFs
Direxion Daily Healthcare Bull 3X Shares ETF
Direxion Daily Technology Bull 3X Shares ETF
Direxion Daily Technology Bear 3X Shares ETF
This leveraged ETF seeks investment results that are 300% of the return of its benchmark index for a single day. The ETF should not be expected to provide returns which are three times the return of its benchmark’s cumulative return for periods greater than a day. Investing in a Direxion Shares ETF may be more volatile than investing in broadly diversified funds. The use of leverage by an ETF increases the risk to the ETF. The Direxion Shares ETFs are not suitable for all investors and should be utilized only by sophisticated investors who understand leverage risk, consequences of seeking daily leveraged investment results and intend to actively monitor and manage their investment.
S&P 500 Index – Standard & Poor’s® selects the stocks comprising the S&P 500® Index (SPXT) on the basis of market capitalization, financial viability of the company and the public float, liquidity and price of a company’s shares outstanding. The Index is a float-adjusted, market capitalization-weighted index. One cannot directly invest in an index.
CURE Risks – An investment in the Fund involves risk, including the possible loss of principal. The Fund is non-diversified and includes risks associated with the Fund’s concentrating its investments in a particular industry, sector, or geographic region which can result in increased volatility. The use of derivatives such as futures contracts and swaps are subject to market risks that may cause its price to fluctuate over time. The Fund does not attempt to, and should not be expected to, provide returns which are three times the performance of its underlying index for periods other than a single day. Risks of the Fund include Effects of Compounding and Market Volatility Risk, Leverage Risk, Counterparty Risk, Intra-Day Investment Risk, Daily Index Correlation/Tracking Risk, Other Investment Companies (including ETFs) Risk, and risks specific to investment in the securities of the Health Care Sector. Please see the summary and full prospectuses for a more complete description of these and other risks of the Fund.
TECL/TECS Risks – An investment in each Fund involves risk, including the possible loss of principal. Each Fund is non-diversified and includes risks associated with the Funds’ concentrating their investments in a particular industry, sector, or geographic region which can result in increased volatility. The use of derivatives such as futures contracts and swaps are subject to market risks that may cause their price to fluctuate over time. Each Fund does not attempt to, and should not be expected to, provide returns which are three times the return of their underlying index for periods other than a single day. Risks of each Fund include Effects of Compounding and Market Volatility Risk, Leverage Risk, Counterparty Risk, Intra-Day Investment Risk, risks specific to the Technology Sector, such as Technology and Telecommunications Risk, for the Direxion Daily Technology Bull 3X Shares, Daily Index Correlation/Tracking Risk and Other Investment Companies (including ETFs) Risk, and for the Direxion Daily Technology Bear 3X Shares, Daily Inverse Index Correlation/Tracking Risk, and risks related to Shorting and Cash Transactions. Please see the summary and full prospectuses for a more complete description of these and other risks of each Fund.

