

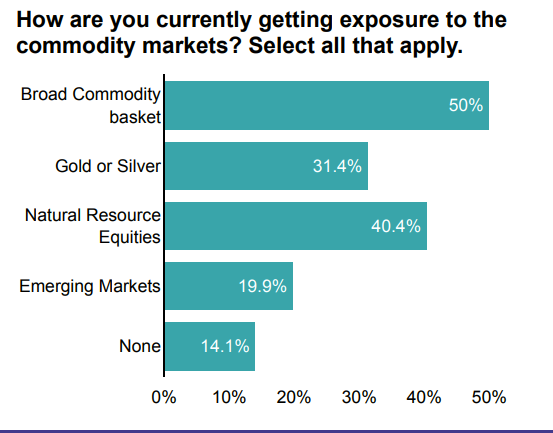
At the end of June, VettaFi asked advisors about their growing interest in commodities during a webcast hosted with Direxion, and I was pleasantly surprised. While 50% of respondents said they were currently getting exposure to commodity markets through a broad commodity basket, only 31% chose precious metals options of gold or silver. Rather, the second most-selected option was natural resource equities (40%). It is encouraging that so many advisors take a broader approach to accessing commodity trends than just owning the SPDR Gold Shares (GLD ) or the Invesco Optimum Yield Diversified Commodity Strategy ETF (PDBC ).
The four largest of these natural resources equity ETFs manage $12 billion in assets and yet have pulled in nearly $3 billion of net inflows this year. These ETFs are heavily concentrated in the energy and materials sectors that are benefiting from high commodity prices, with a smaller stake in consumer staples. While the ETFs have different records than one another this year, they all significantly outperformed the year-to-date 21% loss for the Vanguard Total Stock Market ETF (VTI ) as of July 12.
The two largest ETFs of the quartet are well diversified globally, providing exposure to Australia, Brazil, Finland, France, and the U.K, but the two stronger year-to-date performers focus only on companies domiciled in Canada and the United States.
The FlexShares Morningstar Global Upstream Natural Resources Index Fund (GUNR ) has $7.3 billion in assets, aided by nearly $1 billion of net inflows this year. GUNR was down 2.3% year-to-date through July 12.
Meanwhile, the SPDR S&P Global Natural Resources ETF (GNR ) has $3.2 billion, aided by $1.3 billion of new money this year. GNR was down 6.6% for the year.
In contrast, the *iShares North American Natural Resources ETF (IGE ) rose 11% for the year. This strong performance helped boost investor interest, as the ETF gathered nearly $400 million to push its asset base to approximately $855 million in assets.
A North American-focused peer, the SPDR S&P North American Natural Resources ETF (NANR ) pulled in $116 million and rose 6.0% in value to grow to over $620 million in assets.
The different performance records were due to what is inside these thematic ETFs not only at the country level, but at the stock level.
For example, Exxon Mobil is held by all four of these ETFs, but the exposure is distinct. In mid-July, IGE recently held a 10% stake in the U.S. energy heavyweight, modestly more than the 7.8% position for NANR, but significantly more than GUNR (4.7%) and GNR (4.0%).
Meanwhile, while Archer-Daniels Midland (ADM) is the second-largest position for NANR at 6.8%, it is not owned by North American peer IGE.
We expect strong relative performance, coupled with interest in owning equities that can benefit during inflationary times, to spur further adoption of these natural resource ETFs. However, we caution advisors from buying one without awareness of what makes the ETF unique.
To see more of Todd’s research, reports, and commentary on a regular basis, please subscribe here.
For more news, information, and strategy, visit the Multi-Asset Channel.

