ETFdb Logo
  • ETF Database
  • Content Hubs
    • Themes
      • Active ETF
      • Alternatives
      • Artificial Intelligence
      • China Insights
      • Core Strategies
      • Crypto
      • Disruptive Technology
      • Energy Infrastructure
      • ETF Building Blocks
      • ETF Investing
      • ETF Strategist
      • Financial Literacy
      • Fixed Income
      • Free Cash Flow
      • Future ETFs
      • Innovative ETFs
      • Institutional Income Strategies
      • Leveraged & Inverse
      • Market Insights
      • Market Outlooks
      • Modern Alpha
      • Nuclear Energy
      • Portfolio Strategies
      • Sector Investing
      • Tax Efficient Income
      • Thematic Investing
    • Asset Class
      • Equity
        • U.S. Equity
        • Int'l Developed
        • Emerging Market Equities
      • Alternatives
        • Gold/Silver/Critical Materials
        • Cryptocurrency
        • Currency
        • Volatility
      • Fixed Income
        • Investment Grade Corporates
        • US Treasuries & TIPS
        • High Yield Corporates
        • Int'l Fixed Income
    • ETF Ecosystem
    • ETFs in Canada
    • Market Outlook
    • Crypto ETF Hub
  • Tools
    • ETF Screener
    • ETF Country Exposure Tool
    • ETF Database Categories
    • Indexes
    • Scenario Analysis
    • Watchlists
    • Head-To-Head ETF Comparison Tool
    • Mutual Fund To ETF Converter
    • ETF Stock Exposure Tool
    • ETF Issuer Fund Flows
  • Research
    • ETF Education
    • Equity Investing
    • Dividend ETFs
    • Leveraged ETFs
    • Inverse ETFs
    • Index Education
    • Index Insights
    • Top ETF Sectors
    • Top ETF Issuers
    • Top ETF Industries
  • Webcasts
  • Sectors
    • Sector Investing Content Hub
    • XLK
    • XLI
    • XLU
    • XLY
    • XLP
    • XLRE
    • Sector Power Rankings
    • XLE
    • XLC
    • XLF
    • XLV
    • XLB
  • Multimedia
    • ETF 360 Video Series
    • ETF of the Week Podcast
    • Gaining Perspective Podcast
    • ETF Prime Podcast
    • Video
  • Company
    • About VettaFi
  • PRO
    • Pro Content
    • Pro Tools
    • Advanced
    • FAQ
    • Free sign up
    • Login
  1. Portfolio Strategies Content Hub
  2. Equal-Weight Energy ETF Getting a New Index
Portfolio Strategies Content Hub
Share

Equal-Weight Energy ETF Getting a New Index

Tom LydonJan 10, 2022
2022-01-10

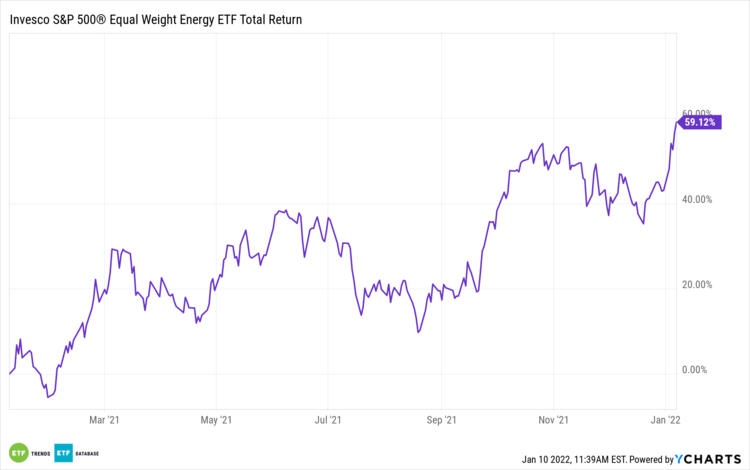
Like so many energy exchange traded funds, the Invesco S&P 500 Equal Weight Energy ETF (RYE B+) posted stellar returns in 2021.

Invesco SP 500 Equal Weight Energy ETF

That doesn’t mean that a bit of an alteration won’t help the equal-weight energy ETF. Currently, RYE follows the S&P 500 Equal Weight Energy Index, the equal-weight counterpart to the cap-weighted S&P 500 Energy Index. However, RYE is moving to another index.

In a recent filing with the Securities and Exchange Commission (SEC), Invesco details plans to shift RYE to the S&P 500 Equal Weight Energy Plus Index. That change goes into effect at the close of U.S. markets on March 18.

Currently, RYE holds 22 companies, and there’s a plan in place in case the new index cannot provide the ETF with at least that number.

“In the event there are fewer than 22 companies eligible for inclusion in the New Underlying Index at a quarterly rebalance, the New Underlying Index will be supplemented with the largest energy companies in the S&P MidCap 400 Index based on float-adjusted market capitalization until the 22 company minimum is reached,” according to the SEC filing.

RYE’s new benchmark launched last November and is rebalanced in March, June, September, and December. As of December 31, the index’s 22 components had a median market capitalization of $30.26 billion, and the largest component commanded a weight of 4.9%.

Due to RYE’s stellar start to 2022 — it surged 11.2% last week — the average market capitalization of its components is $50.1 billion. Its largest holding, refining giant Valero Energy (NYSE:VLO), has a 5% weight in the fund.

It’s not uncommon for equal-weight sector funds to assign what appear to be large weights to small numbers of stocks. Still, RYE is far more diverse than the S&P 500 Energy Index, where Exxon Mobil (NYSE:XOM) and Chevron (NYSE:CVX) combine for nearly 44%. The two largest U.S. companies combine for just 9.45% of RYE.

RYE’s holdings range in weight from 4.35% to 5.03%, and 76% are classified as mid-cap stocks. The $301 million ETF debuted in November 2006 and carries an annual fee of 0.40%, or $40 on a $10,000 investment.

For more news, information, and strategy, visit our Portfolio Strategies Channel.

Loading Articles...

Advertisement

Is Your Portfolio Positioned With Enough Global Exposure?

ETF Education Channel

How to Allocate Commodities in Portfolios

Tom LydonApr 26, 2022
2022-04-26

A long-running debate in asset allocation circles is how much of a portfolio an investor should...

Core Strategies Channel

Why ETFs Experience Limit Up/Down Protections

Karrie GordonMay 13, 2022
2022-05-13

In a digital age where information moves in milliseconds and millions of participants can transact...

}
X