ETFdb Logo
  • ETF Database
  • Content Hubs
    • Themes
      • Active ETF
      • Alternatives
      • Artificial Intelligence
      • China Insights
      • Core Strategies
      • Crypto
      • Disruptive Technology
      • Energy Infrastructure
      • ETF Building Blocks
      • ETF Investing
      • ETF Strategist
      • Financial Literacy
      • Fixed Income
      • Free Cash Flow
      • Future ETFs
      • Innovative ETFs
      • Institutional Income Strategies
      • Leveraged & Inverse
      • Market Insights
      • Market Outlooks
      • Modern Alpha
      • Nuclear Energy
      • Portfolio Strategies
      • Sector Investing
      • Tax Efficient Income
      • Thematic Investing
    • Asset Class
      • Equity
        • U.S. Equity
        • Int'l Developed
        • Emerging Market Equities
      • Alternatives
        • Gold/Silver/Critical Materials
        • Cryptocurrency
        • Currency
        • Volatility
      • Fixed Income
        • Investment Grade Corporates
        • US Treasuries & TIPS
        • High Yield Corporates
        • Int'l Fixed Income
    • ETF Ecosystem
    • ETFs in Canada
    • Market Outlook
    • Crypto ETF Hub
  • Tools
    • ETF Screener
    • ETF Country Exposure Tool
    • ETF Database Categories
    • Indexes
    • Scenario Analysis
    • Watchlists
    • Head-To-Head ETF Comparison Tool
    • Mutual Fund To ETF Converter
    • ETF Stock Exposure Tool
    • ETF Issuer Fund Flows
  • Research
    • ETF Education
    • Equity Investing
    • Dividend ETFs
    • Leveraged ETFs
    • Inverse ETFs
    • Index Education
    • Index Insights
    • Top ETF Sectors
    • Top ETF Issuers
    • Top ETF Industries
  • Webcasts
  • Sectors
    • Sector Investing Content Hub
    • XLK
    • XLI
    • XLU
    • XLY
    • XLP
    • XLRE
    • Sector Power Rankings
    • XLE
    • XLC
    • XLF
    • XLV
    • XLB
  • Multimedia
    • ETF 360 Video Series
    • ETF of the Week Podcast
    • Gaining Perspective Podcast
    • ETF Prime Podcast
    • Video
  • Company
    • About VettaFi
    • Get VettaFi’ed
  • PRO
    • Pro Content
    • Pro Tools
    • Advanced
    • FAQ
    • Free sign up
    • Login
  1. Volatility Resource Content Hub
  2. Amid Market Volatility This Low-Vol ETF Signals a Buy
Volatility Resource Content Hub
Share

Amid Market Volatility This Low-Vol ETF Signals a Buy

Nick Peters-GoldenApr 10, 2023
2023-04-10

Low volatility strategies have been on the radar at VettaFi recently, especially following last month’s bank crisis. The bank crisis may still be with us, too, if you ask Jamie Dimon. The immediate wave of banking contagion may have subsided, but this year suggests a lot more volatility to come, inviting advisors and investors to consider a low-vol ETF like the Franklin U.S. Low Volatility High Dividend ETF (LVHD A) which recently hit a notable buy signal.

LVHD, which hit $1 billion in AUM earlier this year and hasn’t looked back since, sitting at $1.1 billion as of the start of April, also sat above both its 200-Day Simple Moving Average (SMA) and its 50-Day SMA as of market close on Thursday, priced at $37.62, a key buy signal that it hadn’t shown since January when it began its strong price momentum. With some distance to go to reach those initial heights, it may be reflecting regained momentum that’s worth tracking.

See more: Franklin Templeton’s Mann on 2023, Smart Beta, Income

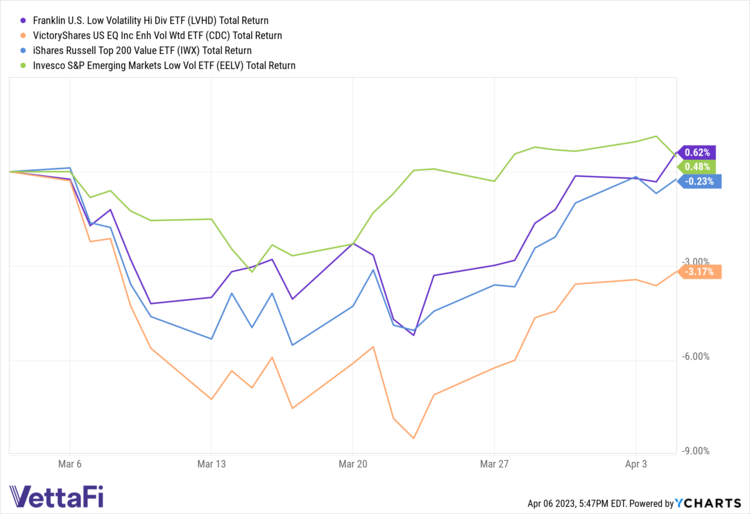
LVHD charges just 27 basis points (bps) to track the QS Low Volatility High Dividend Index, and, approaching eight years of operation, it’s performed well over the last month according to YCharts. LVHD tracks 50 to 100 stocks selected and weighted for profitability, high dividends, and low price volatility, looking for what it calls “stable yield” via dividend sustainability, assessed based on fundamental and technical factors.

LVHD CDC IWX EELV Chart

LVHD has added $124 million over the last month in net inflows, suggesting notable momentum and investor attention. In terms of dividends, it has largely made good on its stated mission, with an annual dividend yield of 3.26% and outdoing the ETF Database Category Average and the Facset Segment Average annual dividend yields, too. Finally, LVHD has seen just 14.3% volatility over the last 50 days compared to its peer group ETF Database category.

U.S. equities are a tricky place to be right now, that’s for sure, but there are ways around that volatility in a low-vol ETF. LVHD is showing some signs that it’s worth watching in the space, and with the Fed’s fight against inflation and the bank crisis just two of many possible risk factors, it may be a strategy worth keeping an eye on.

For more news, information, and analysis, visit the Volatility Resource Channel.

VettaFi is an independent publisher and takes responsibility for our edit staff, research, and postings. Franklin Templeton is not affiliated with VettaFi and was not involved in drafting this article. The opinions and forecasts expressed are solely those of VettaFi and may not actually come to pass. Information on this site should not be used or construed as an offer to sell, a solicitation of an offer to buy, or a recommendation for any product.


Content continues below advertisement

Loading Articles...

Advertisement

Is Your Portfolio Positioned With Enough Global Exposure?

ETF Education Channel

How to Allocate Commodities in Portfolios

Tom LydonApr 26, 2022
2022-04-26

A long-running debate in asset allocation circles is how much of a portfolio an investor should...

Core Strategies Channel

Why ETFs Experience Limit Up/Down Protections

Karrie GordonMay 13, 2022
2022-05-13

In a digital age where information moves in milliseconds and millions of participants can transact...

}
X