
Commodity investing has long been known for its volatility, attracting traders who seek large daily movements to generate returns. After the ETF industry made investing in these hard assets more accessible, the popularity of utilizing these assets reached new highs. Over the past few years, commodity ETFs have seen a number of wild rides, as their underlying assets have made violent swings time and again.
Below, we present a history of some of the most notable commodity ETF swings ever and what fueled these massive movements.
For more ETF news and analysis subscribe to our free ETF Daily Roundup.
Coffee Catches Fire
- ETF: Dow Jones-UBS Coffee ETN (JO )
- When: January 2014 – March 2014
- Gain: ~90%
Early in 2014, coffee futures caught fire after a hot and dry summer in Brazil spooked the market. Brazil is by far the largest producer of the commodity, as it produced more than 5.6 billion pounds of coffee in 2013. The drought in the summer of 2014 has damaged the coffee crops and has created concerns over 2015′s harvest as well.
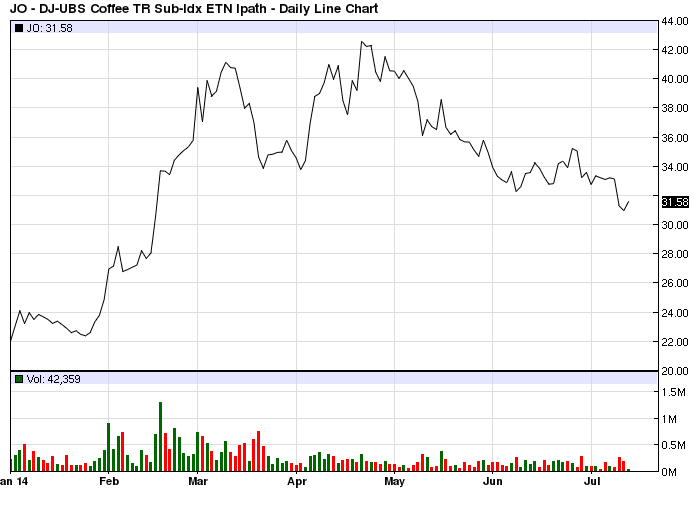
After a quick correction in March, coffee futures spiked even higher in April, only to calm down after. The fears over the 2015 crop output will likely keep futures elevated for some time, though perhaps not at their current levels.
Grains and the U.S. Drought
- ETF: DJ-UBS Grains Total Return Sub-Index ETN (JJG )
- When: June 2012 – July 2012
- Gain: ~50%
The summer of 2012 was a tough one for the U.S., the leading grain producing region in the world. In fact, 2012 was the hottest year recorded since records have been kept for such a stat. In just a few weeks, the drought and searing heat sent grains commodities on a tear.
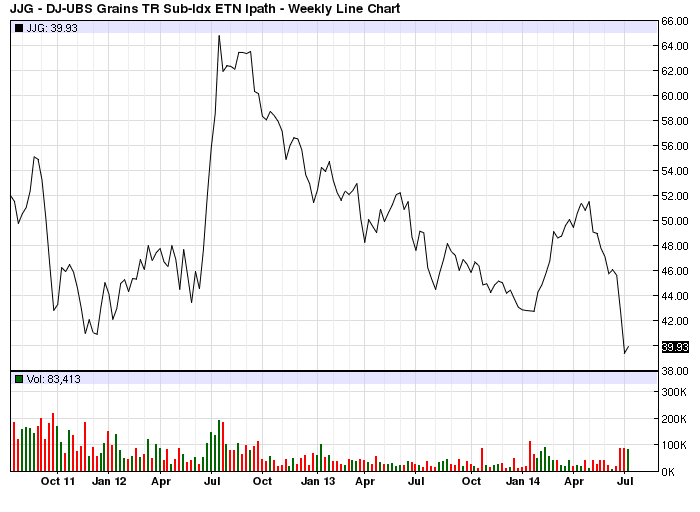
Some individual grains performed better than others, but all saw a major lift as a result of the harsh weather. Most of the grains commodities have since calmed down, with a particularly large sell-off in mid-2014 that brought most prices back down to pre-drought levels.
Silver Shines Bright
- ETF: Silver Trust (SLV )
- When: August 2010 – April 2011
- Gain: ~165%
Precious metals took off in 2011, as money printing and bond-buying programs from the Fed created an increased appetite for these hard assets. Silver took the news especially well, tacking on massive gains in just a matter of months.
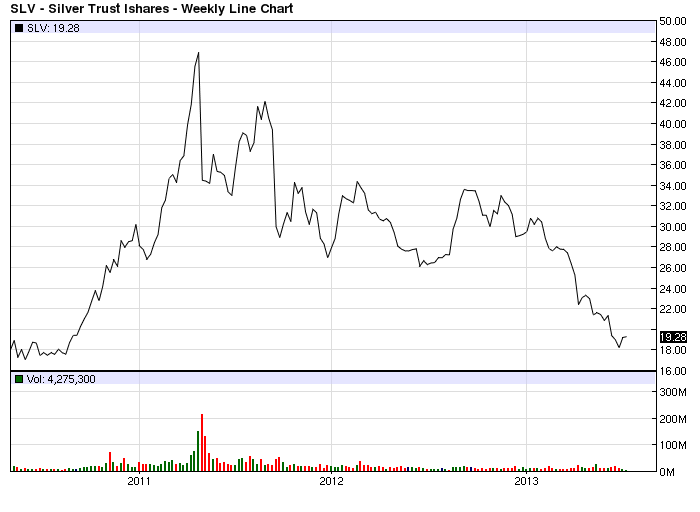
Unfortunately for this white metal, its fall from grace was swift, including two harsh sell-offs in 2011 that brought the commodity back down to earth. As equities continue the unprecedented bull run, silver (as well as its precious metals counterparts) has struggled to gain traction.
Cotton Makes a Run
- ETF: Dow Jones-UBS Cotton Total Return Sub-Index ETN (BAL )
- When: July 2010 – March 2011
- Gain: ~185%
A cocktail of supply concerns sent cotton on a major run higher in mid 2010, as demand for the fluffy commodity refused to give up.
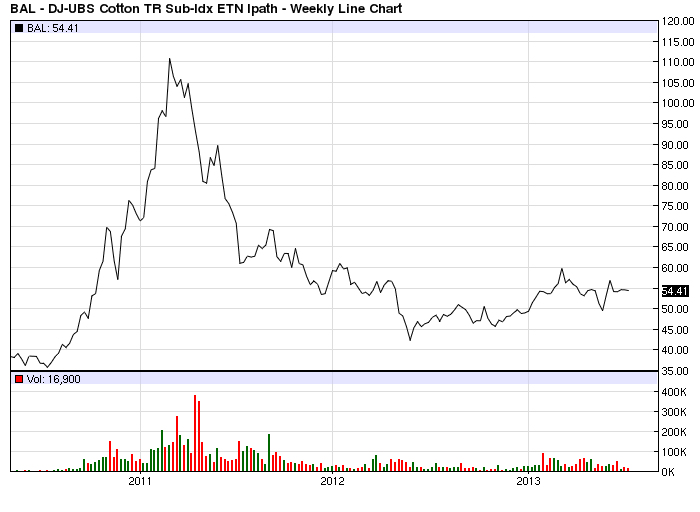
Cotton quickly sold-off after making its peak and fell to more manageable levels, where it has remained since its spike.
Sugar Sweetens
- ETF: Dow Jones-UBS Sugar Subindex Total Return ETN (SGG )
- When: May 2010 – January 2011
- Gain: ~155%
Sugar has rarely had a dull moment over the last few years, as the commodity is no stranger to major moves up and down. The sweet commodity saw a strong run-up in 2009 before pulling back early the following year. From there, it enjoyed a strong upward momentum as tight supplies kept plenty of pressure on prices.
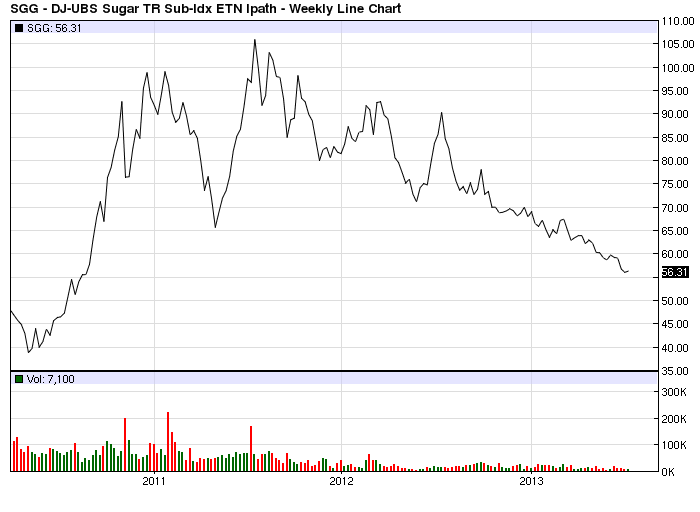
Sugar would eventually cool-off and trend lower over the next few years with a few spikes here and there.
UNG Heats Up
- ETF: United States Natural Gas ETF (UNG )
- When: December 2007 – July 2008
- Gain: ~80%
The end of 2007 and beginning of 2008 saw fossil fuel prices spike, with natural gas enjoying gains that set itself apart from its peers.
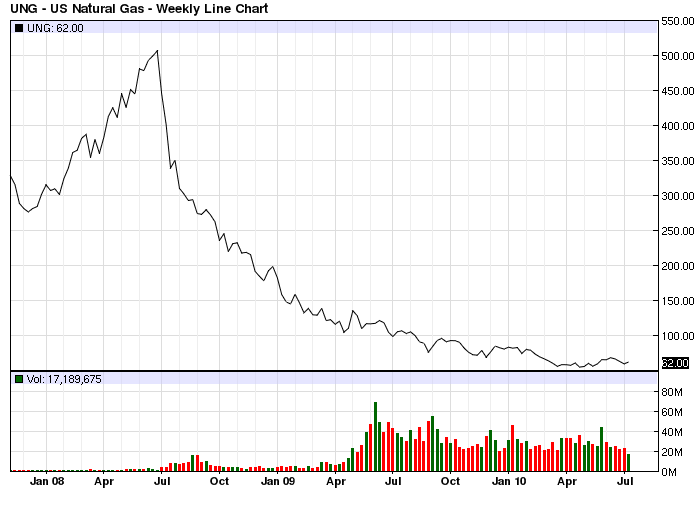
Since making highs in 2008, UNG has rarely had any kind of positive momentum as the fund was forced to undergo a 1-for-4 reverse split in early 2012 to keep its share price above $5. Though the fund has shown some promising signs as of late, natural gas and UNG have yet to establish a clear momentum.
The Bottom Line
Commodity ETFs are well-known for their volatility, demanding that investors pay special attention to these particular positions. They are most often impacted by weather concerns and how that interacts with the supply/demand equation. Commodity investments require special attention, but have the potential to produce some seriously lucrative returns.
Follow me on Twitter @JaredCummans.
For more ETF analysis, make sure to sign up for our free ETF newsletter.
Disclosure: No positions at time of writing.

