

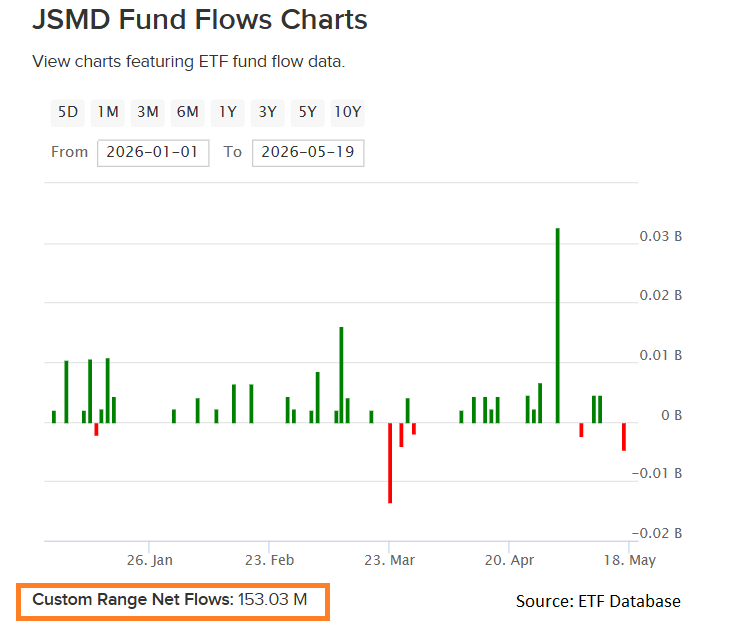
Industry discussions on Janus Henderson’s ETF lineup are typically centered around its fixed income funds given the firm’s history in this asset class. However, the issuer also has equity ETFs that are garnering attention, which include a fund that’s close to crossing the $1 billion assets under management (AUM) threshold: the Janus Henderson Small-Mid Cap Growth Alpha ETF (JSMD ).
Despite a market that’s heavily favoring large caps in a challenging macro environment, JSMD has taken in over $150 million in net flows this year. It’s an ideal fund to consider for investors looking to add exposure to SMID-cap companies whose valuations may appear compelling relative to their large-cap peers.
SMID-Caps Now?
A higher-for-longer rate environment typically doesn’t bode well for small- and mid-cap companies, especially those whose balance sheets are heavily laden with debt. This is where a fund with an active mandate like JSMD is beneficial as it allows portfolio managers to dynamically adjust holdings as necessary to suit current market conditions.
As mentioned, large-cap valuations could potentially be stretched, which opens the door for portfolios to add SMID-cap diversification. SMID-caps are typically comprised of nimbler companies positioned to capture domestic structural tailwinds, supply chain reshoring, and specialized niche growth. As such, they can offer greater growth upside that their large-cap peers may not.
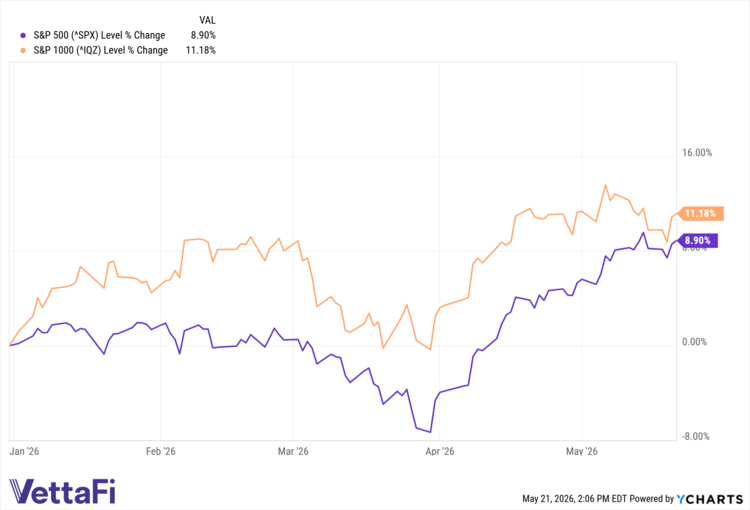
Despite the current macro challenges, SMID-caps (represented by the S&P 1000) are outperforming large caps in the aggregate year-to-date. The S&P 500 is trailing the S&P 1000 by just over 2% when the performances of both indices are juxtaposed. The performance disparity could widen in favor of SMID-caps if the incoming Fed chair, Kevin Warsh, cuts rates though it appears that inflation remains an ongoing concern.
JSMD: Unshackled Into Fully Active Alpha
Incepted in 2016, JSMD actually began life as a passive fund tracking the Janus Small Mid Cap Growth Alpha Index. Following an official structural update from Janus Henderson, the fund now employs an actively managed strategy.
Without the shackles of an index, JSMD’s managers can now use a systematic, active research approach to navigate volatile market environments in real-time. They can cut exposure to deteriorating growth stories while hunting for overlooked alpha across the mid- and small-cap spectrum.
The fund’s portfolio managers invest in SMID-cap equities using a proprietary quantitative methodology. The fund selects stocks based on fundamental research factors to generate alpha and maximize excess returns. Portfolio optimization techniques are used to tightly manage risk relative to its benchmark: the Russell 2500 Growth Index.
TMSL: Another Active Option
Optionality is necessary when looking for ETF opportunities in the SMID-cap space. Because it’s now actively managed, another comparable ETF is the T. Rowe Price Small-Mid Cap ETF (TMSL ). The fund is barely three years old and already boasts close to $2.2 billion in AUM.
For investors who prefer their equities chosen with an organic, bottom-up research approach, TSML is ideal. The fund’s portfolio managers have the tactical freedom to select high-conviction companies across both growth and value disciplines. With its rigorous research process, the fund relies on resilient business models, management execution, and structural industry tailwinds to build its portfolio.
See more: Are SMIDcaps Delivering? TMSL up 8% YTD
The Differences Between the 2 Funds
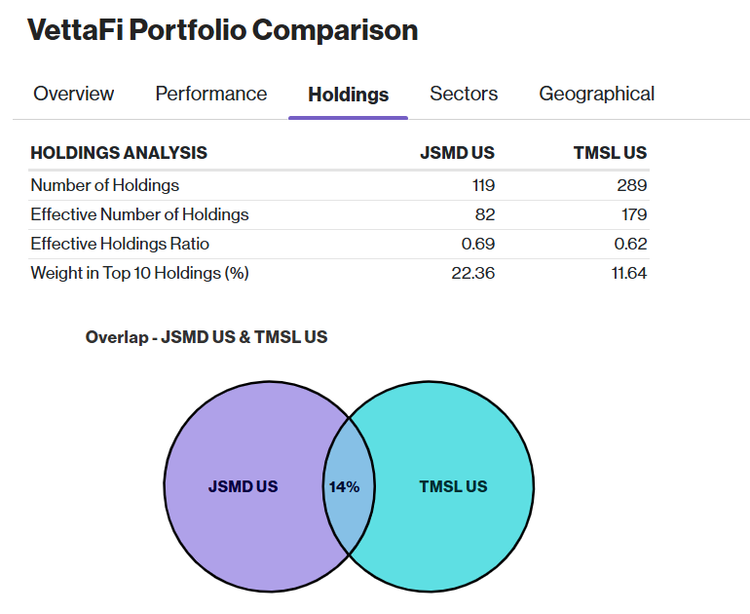
Methodologies aside, a look at the holdings of both JSMD and TMSL further reveals the differences in both funds. There’s only a 14% overlap between the two when looking at the holdings analysis. TMSL is more heavily diversified with close to 300 holdings while JSMD maintains a higher conviction portfolio with 119 holdings and its top 10 weight in just over 22%. Despite having less than half the holdings of TMSL, JSMD’s effective number of holdings (82) and high ratio (0.69) signal balanced diversification across a leaner portfolio.
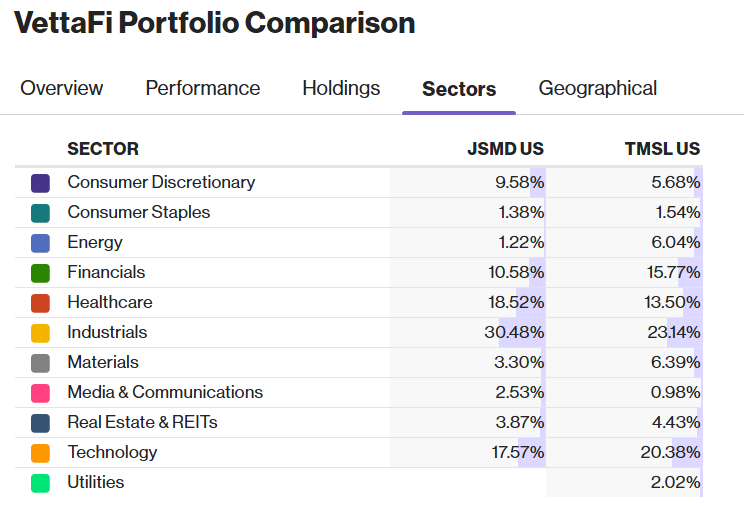
Further variances in both funds can be found in their sector exposure. Some notable allocation differences is the higher exposure to Consumer Discretionary, Healthcare, and Industrials in JSMD. TMSL, on the other hand, carries more notable exposure to sectors like Energy, Financials, Materials, and Technology.
Systematic vs. Fundamental Research
For portfolio allocators, the choice between JSMD and TMSL is entirely up to them. JSMD’s manager-led framework retains a systematically disciplined, growth-and-quality-focused factor approach to SMID-cap companies.
While it carries an expense ratio that’s 25 bps higher, TMSL provides a portfolio that’s backed by fundamental analysts who select SMID-cap companies that quantitative screens might overlook. In the end, both funds provide relief from mega-cap concentration and offer diversification through active SMID-cap options.
| Feature | Janus Henderson Small-Mid Cap Growth Alpha ETF | T. Rowe Price Small-Mid Cap ETF | ||||
|---|---|---|---|---|---|---|
| Ticker | JSMD | TMSL | ||||
| Issuer | Janus Henderson Investors | T. Rowe Price | ||||
| Expense Ratio | 0.30% | 0.55% | ||||
| Management Style | Active (Systematic / Quantitative) | Active (Fundamental Research / Multi-Style) | ||||
| Benchmark Index | Russell Midcap Growth Index | Russell 2500 Index | ||||
| Core Investment Strategy | Focuses on high-quality small-to-mid-cap growth compounders, using a proprietary quantitative model evaluating organic revenue growth, margin expansion, and high ROIC. | Targets a flexible, blended mix of small- and mid-cap companies across both growth and value styles, backed by global bottom-up research. | ||||
| Portfolio Approach | Disciplined factor exposure with portfolio optimization to manage benchmark-relative risk. | Unconstrained stock-picking alpha with full tactical freedom to make concentrated, off-benchmark bets. | ||||
| Total Number of Holdings | ~119 | ~289 | ||||
For more news, information, and analysis, visit the Equity ETF Content Hub.

