

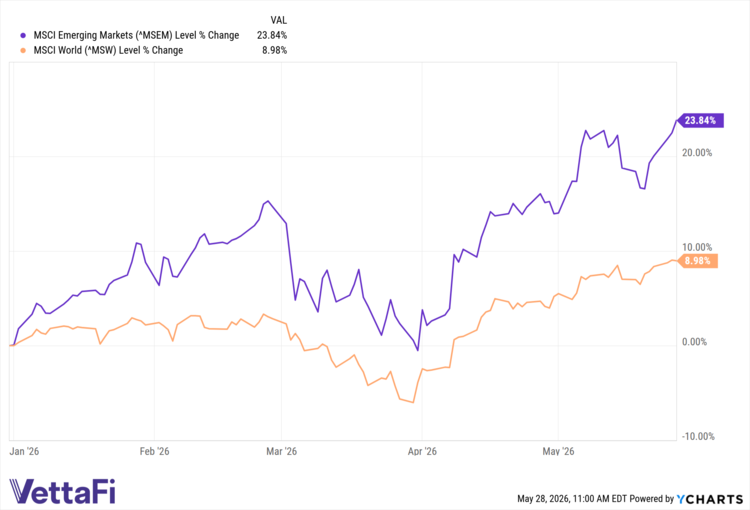
Global market uncertainty, inflation, and higher-for-longer interest rates should be keeping emerging market (EM) performance bottled up, then saved for another day. However, the MSCI Emerging Markets Index is leaving the MSCI World Index in the dust, outperforming it by about 15% year-to-date (YTD).
That said, it warrants a look underneath the hood of the ETF market’s two largest options, the Vanguard FTSE Emerging Markets ETF (VWO ) and the iShares Core MSCI Emerging Markets ETF (IEMG ). While both funds are ideal avenues to capture the growth drivers of EM, a critical nuance in country classification and sector exposure changes their return trajectories.
The Korean Linchpin
The prime differentiator between these two heavyweights boils down to a single geographic boundary: South Korea. In fact, index providers do not share a universal definition of what constitutes an EM country. This definitional differentiation will ultimately shape the portfolios of both funds.
On one hand, VWO tracks the FTSE Emerging Markets All Cap China A Inclusion Index. FTSE Russell classifies South Korea as a developed market, pointing to its highly advanced economic infrastructure, per-capita income metrics, mature capital markets, and other factors that are outlined in a whitepaper. Given this, South Korea is completely excluded from VWO.
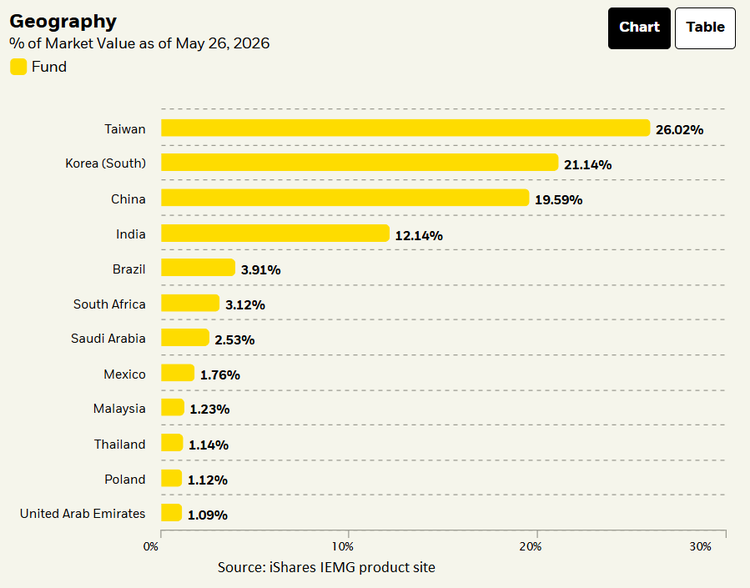
Conversely, IEMG tracks the MSCI Emerging Markets Horizon Index. Under the MSCI Index, South Korea remains categorized as an emerging market, largely due to ongoing restrictions in its offshore currency exchange market and foreign investor registration requirements. Due to this classification variance, South Korea sits comfortably as the second highest country allocation within IEMG, commanding 21% of the fund (as of May 26, 2026).
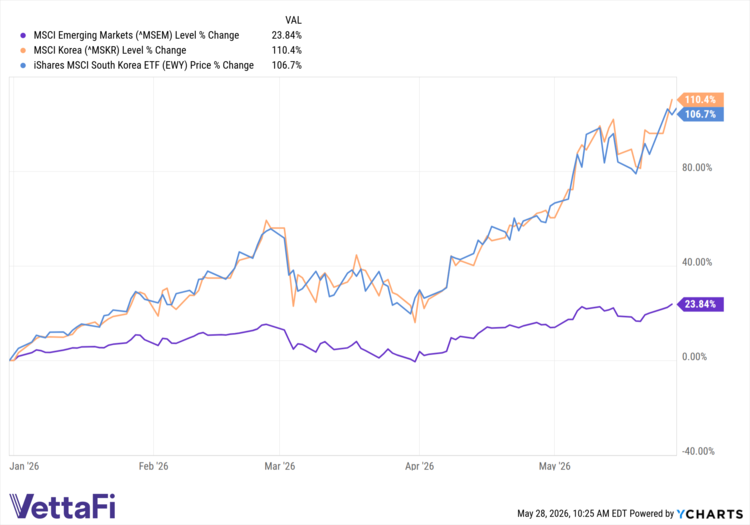
What does that South Korea exposure do to performance? Quite a bit, when you look at how the MSCI Korea Index and specifically the iShares MSCI South Korea ETF (EWY ) have been performing against the broader MSCI Emerging Markets Index.
Tech Dominance Disparity
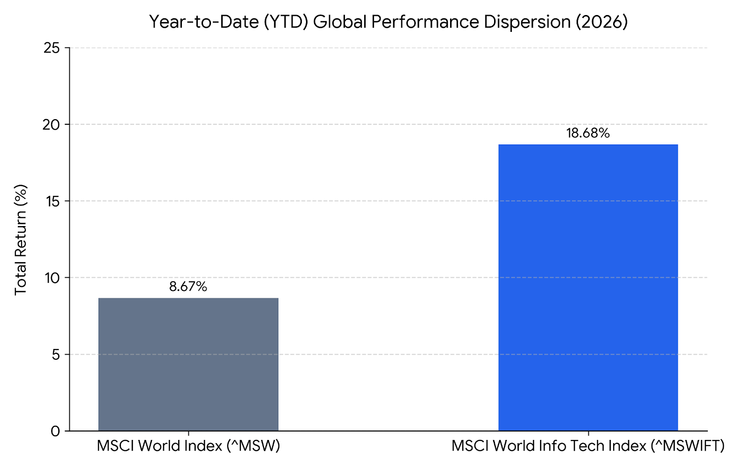
Beyond the South Korea boundary, the performance disparity could also be tied to sector exposure. This performance gap is further crystallized when juxtaposing the year-to-date trajectories of the global MSCI tech index versus the rest of the world. The MSCI World Information Technology Index (MSWIFT) has surged by about 19% year-to-date, leaving the broader, multi-sector MSCI World Index (MSW) trailing far behind at around 9%.
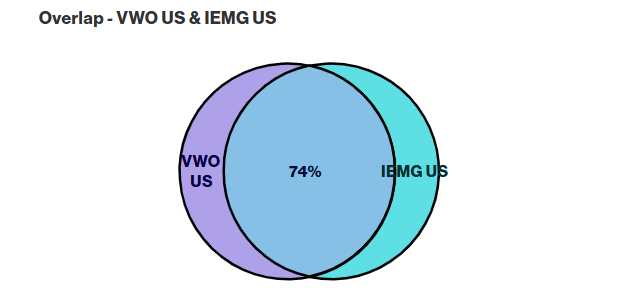
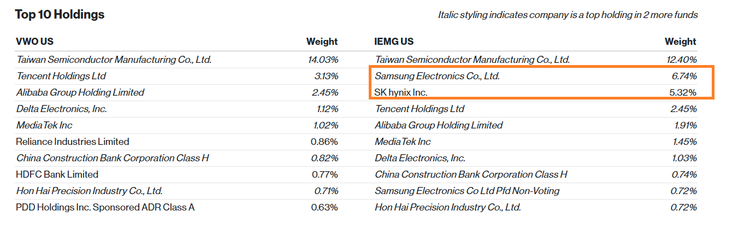
With that, IEMG carries a heavier weight to the vaunted technology sector that’s been driving global market performance, despite the funds having a 74% holdings overlap. The unyielding corporate spending on artificial intelligence (AI), cloud modernization, and advanced enterprise software scaling is helping to propel the tech sector into the upper performance strata.
More specifically, South Korean companies like Samsung Electronics and SK Hynix are creating a one-two punch combo, driving IEMG’s performance as both companies have exceeded $1 trillion in market cap size. They both occupy just over 12% of the IEMG’s allocation. As Business Korea mentioned, South Korea is one of only two countries with more than one company surpassing the $1 trillion market-cap milestone. Summarily, that combination of greater exposure to South Korea and specifically, the tech sector, continue to give IEMG the performance advantage.
Which EM ETF to Choose?
While certainly high on the list, performance shouldn’t be the only screening mechanism for deciding which fund investors should add to their portfolios. As previously mentioned, country overlap could be part of the decision-making process.
Investors looking for South Korea exposure in their global asset allocation will certainly opt for IEMG. As mentioned, South Korea’s current performance trajectory disappears from their global portfolio entirely if they opt for VWO. Performance, of course, can be fleeting in volatile EM equities, so today’s winners may not necessarily be tomorrow’s. If diversifying away risk is more important, VWO has almost double the holdings of IEMG.
Furthermore, Vanguard has the Vanguard FTSE Developed Markets ETF (VEA ), which includes exposure to South Korea. Those with brand loyalty who appreciate Vanguard’s commitment to low expense ratios can simply add VWO to VEA for comprehensive international equities exposure.
| Feature | Vanguard FTSE Emerging Markets ETF | iShares Core MSCI Emerging Markets ETF |
|---|---|---|
| Ticker | VWO | IEMG |
| Issuer | Vanguard | iShares (BlackRock) |
| Expense Ratio | 0.08% | 0.09% |
| Management Style | Passive (Market-Cap Weighted) | Passive (Market-Cap Weighted) |
| Index Tracked | FTSE Emerging Markets All Cap China A Inclusion Index | MSCI Emerging Markets Investable Market Index (IMI) |
| Core Investment Strategy | Seeks comprehensive cap-weighted exposure across emerging market large-, mid-, and small-cap segments, completely excluding South Korea. | Targets a broad footprint of large-, mid-, and small-cap equities across global developing economies, fully retaining South Korea. |
| Portfolio Selection Grid | Follows FTSE classification standards; reallocates capital across alternative developing nations by treating South Korea as a developed market. | Follows MSCI classification guidelines; retains significant capital weight in South Korean tech, manufacturing, and industrial leaders. |
| Total Number of Holdings | ~4,960 | ~2,608 |
For more news, information, and analysis, visit the Equity ETF Content Hub.

