

When evaluating small-cap equity exposure, it’s easy to gravitate towards the iShares Russell 2000 ETF (IWM ) given its $82 billion in assets and 0.19% expense ratio. Yet, a closer look at another fund, the ALPS O’Shares U.S. Small-Cap Quality Dividend ETF (OUSM ), reveals a fundamentally sound structural design that warrants closer attention.
Key Takeaways:
- IWM captures the small-cap universe based purely on market cap, whereas OUSM uses a rules-based quality filter to screen for low-leverage, profitable, dividend-paying companies.
- OUSM avoids volatile energy and real estate sectors, causing it to trail IWM during beta-driven cyclical rallies, but offers downside protection.
- IWM holds a highly diluted basket of nearly 1,900 stocks, while OUSM runs a concentrated portfolio of roughly 100 high-quality companies to drive factor performance.
See More: Quality Small-Caps ETF OUSM Touches $1 Billion Threshold
Quality Focus vs. Index Hugging
The fundamental difference between OUSM and IWM stems from how their portfolios are built. IWM captures the small-cap universe based on pure market capitalization by tracking the Russell 2000 Index. In doing so, it naturally overweights the largest companies within the Index irrespective of its underlying fundamental metrics.
Conversely, OUSM tracks the O’Shares U.S. Small-Cap Quality Dividend Index. As opposed to using a market cap-weighted approach, the fund screens the small cap universe for dividend-paying entities through a rigid, rules-based quality lens that emphasizes four key metrics. This includes quality profitability (strong return on assets and operational efficiency, low leverage, dividend yield, and dividend quality (to avoid dividend traps). In essence, it embraces value, but doesn’t hug an index.
The Performance Paradox
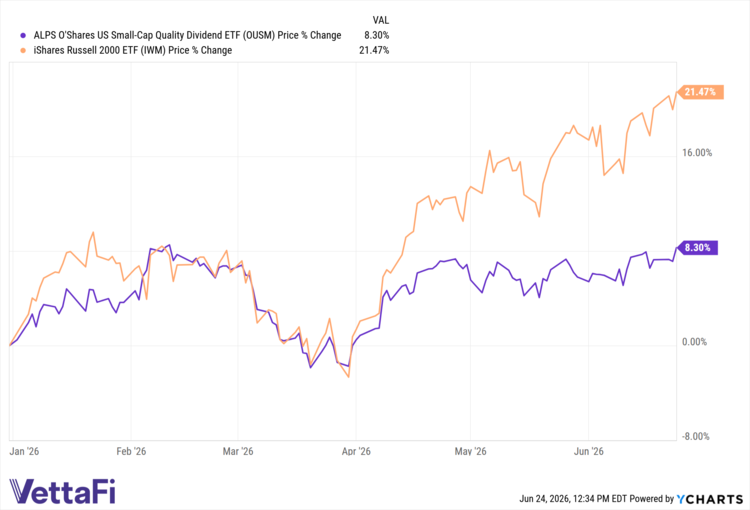
Investors may also be naturally drawn to IWM because it’s the stronger year-to-date performer. Up 21% YTD, it’s outpacing the MSCI USA Small Cap Index, which is up about 18% for the year. At just over 8% YTD, it might be easy to dismiss OUSM, but it offers inherent benefits in a volatile small cap arena.
By prioritizing high profitability and low leverage, OUSM filters out hyper-cyclical, debt-heavy segments of the market. This causes OUSM to completely exclude the energy and real estate sectors, while maintaining scant exposure to materials.
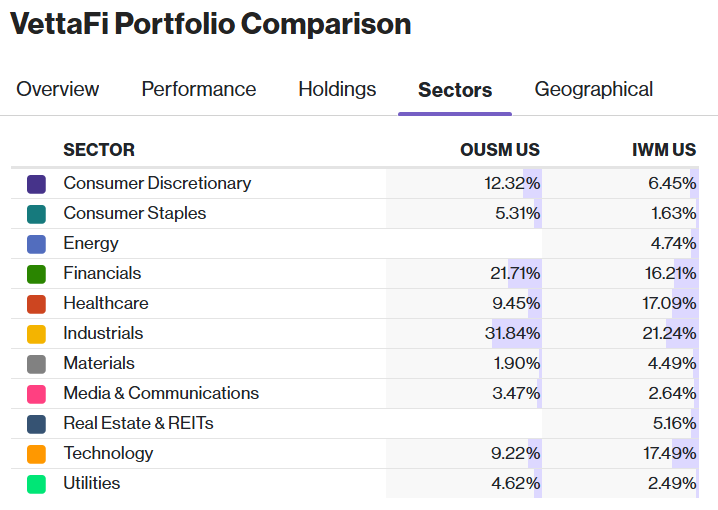
On the other hand, in times of rising energy and commodities prices, IWM’s unconstrained allocations provide exposure to the upside of these cyclical sectors. Furthermore, it has greater exposure to a dominant tech sector versus OUSM as well. Because OUSM mitigates exposure to speculative, volatile sectors in favor of prototypical value segments in financials and industrials, the fund naturally trails behind beta-driven cyclical rallies.
Under The Hood of OUSM and IWM
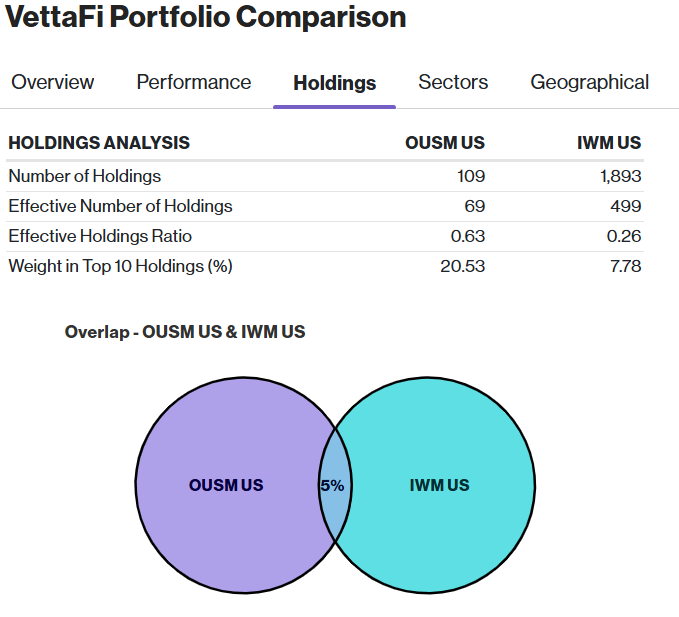
The holdings analysis shows only a 5% overlap between the two portfolios. On one hand, IWM has about 1,900 stocks that, in effect, produce a highly diluted 0.26 effective holdings ratio. This ultimately means its vast constituents barely impact performance, leaving its top 10 positions to drive just 7.78% of the fund.
Conversely, OUSM runs a curated, high-conviction portfolio of just over 100 companies. Because it caps single-stock exposure and selects purely on high-quality dividend metrics, it achieves a higher 0.63 effective holdings ratio. By anchoring 20.5% of its weight in its top 10 positions, OUSM ensures that its quality factor and low volatility screens drive portfolio performance. Investors get a greater emphasis on quality to protect the downside while still participating in small cap upside.
Performance Isn't Everything
As usual, performance is just one aspect to consider when comparing funds. Some investors may appreciate the performance of IWM while others favor OUSM’s risk-mitigation, value-focused framework. By choosing OUSM, investors trade away the wild, cyclical tops of the Russell 2000 in exchange for a smoother, fundamentally sound, and dividend yield-supported portfolio of high-quality companies.
OUSM is further proof that investors don’t necessarily have to go big with IWM when they wish to go small.
| Feature | ALPS | O’Shares U.S. Small-Cap Quality Dividend ETF | iShares Russell 2000 ETF |
|---|---|---|
| Ticker | OUSM | IWM |
| Issuer | ALPS Advisors | BlackRock (iShares) |
| Strategy Type | Multi-Factor Quality Dividend | Broad Market Beta |
| Sector Footprint | Defensive / Yield Focus | Broad Cyclical / Growth |
| Sector Constraints | Excludes Energy and Real Estate | Unconstrained |
| Number of Holdings | ~109 | ~1,893 |
| Effective Holdings Ratio | 0.63 (High Core Concentration) | 0.26 (High Dilution) |
| Weight in Top 10 | 20.53% | 7.78% |
| Underlying Index | O’Shares U.S. Small-Cap Quality Dividend Index | Russell 2000 Index |
| Selection Universe | Quality, dividend-paying U.S. small-cap stocks | U.S. small-caps |
| Expense Ratio | 0.48% | 0.19% |
For more news, information, and analysis, visit the ETF Building Blocks Content Hub.
VettaFi LLC (“VettaFi”) is the index provider for OUSM, for which it receives an index licensing fee. However, OUSM is not issued, sponsored, endorsed, or sold by VettaFi, and VettaFi has no obligation or liability in connection with the issuance, administration, marketing, or trading of OUSM.

