
Investors should always look at fundamental analysis when deciding which exchange-traded funds (ETFs) to purchase, but technical analysis is instrumental in determining exactly when to buy them.
After all, financial ratios reflect changes in a portfolio’s underlying characteristics every few months, but price movements reflect real-time market sentiment. Investors should consider both of these forms of analysis before making any investment decisions.
In this article, we will take an introductory look at technical analysis and how it can be used in market timing when buying and selling ETFs.
Technical Indicators
Technical indicators are the complex-looking lines found above, below, or over the top of prices on a stock chart. These lines are the results of mathematical formulas plotted over the same time frame as the chart, and they provide key insights into market timing.
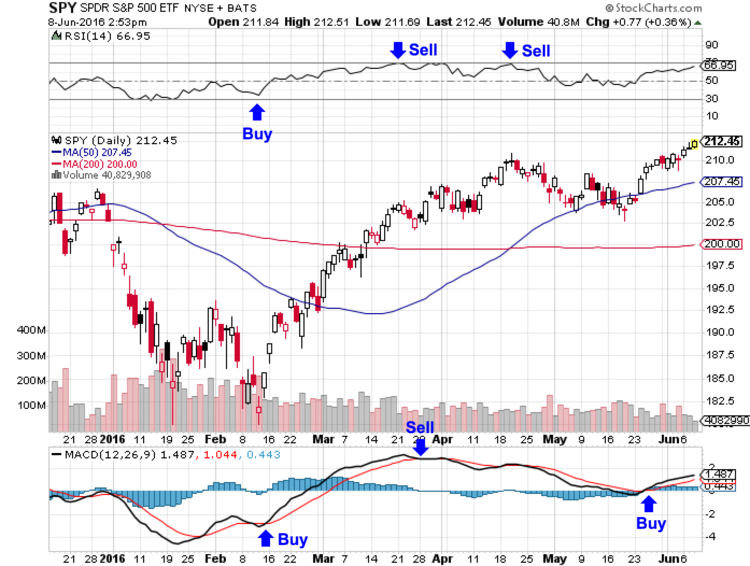
The most basic technical indicator is the moving average, which is typically overlaid on the price of a stock chart. Simply put, the moving average of the current period represents the average (or mean) of a given number of past periods. The most widely followed moving averages are the 50-, 100-, and 200-day moving averages, and investors are often looking to see where the price lies in relation to the moving average — with crossovers being bullish indicators.
The two most popular technical indicators appearing above or below the price chart are the Relative Strength Index (RSI) and the Moving Average Convergence/Divergence (MACD). The RSI measures the momentum of a price, with readings below 30 indicating oversold conditions and above 70 indicating overbought conditions. The MACD measures the space between two moving averages as they converge in either direction, with investors looking for crossovers.
There are literally hundreds of other technical indicators available to investors that leverage a number of different mathematical formulas. Although the moving average, RSI and MACD are the most popular technical indicators, investors should experiment with the many other options available to see if they offer any additional insights. Those looking to take things a step further can even explore creating their own technical indicators using technical analysis software.
For more information on technical analysis, read Understanding ETF Technical Analysis.
Chart Patterns
Chart patterns are quite simply patterns that appear in prices that are indicative of the market’s psychology at a given point in time. These patterns often provide insight into where prices may be headed based on their past movements over the short to long term.
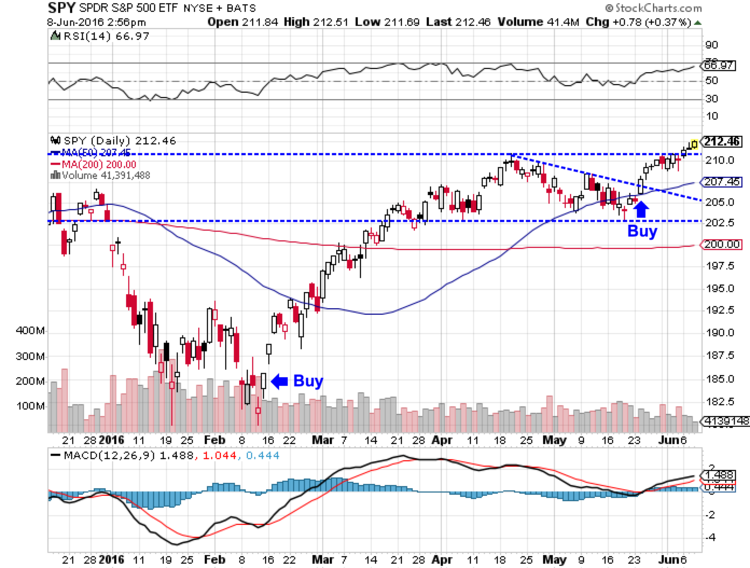
The genesis of every chart pattern is a trend line, which is a straight line that connects a series of consecutive lows or highs. After making these connections, a variety of different chart patterns can emerge, ranging from triangles to waves. Each of these patterns predicts a different potential future price movement. For instance, an ascending triangle is indicative of a potential breakout that is higher if the price moves above the trend line resistance.
Candlestick chart patterns are shorter-term chart patterns that look at the price movement over one to three different periods, or bars. For instance, a bullish engulfing is a two to three period candlestick chart pattern that is indicative of a future increase in price, whereas a doji star is a single period candlestick chart pattern that is indicative of a potential price reversal coming in the near term. These are helpful for making short-term predictions for the future.
As with technical indicators, investors should experiment with different types of chart patterns to determine what works best for them. Trend line breakouts are perhaps the best place to start due to their simplicity, but many traders swear by complex chart analysis, such as Elliott’s Waves, when predicting prices over the long term.
Review our FAQ page on technical trading.
The Bottom Line
Technical analysis is a great way to discover when to purchase or sell an ETF based on a combination of mathematical and psychological factors. By leveraging these techniques, investors can help time their purchases to maximize their returns over time, while setting intelligent stop-loss and take-profit points to lock in gains.

