ETFdb Logo
ETFdb Logo
  • ETF Database
  • Channels
    • Active ETF
    • Beyond Basic Beta
    • China Insights
    • Climate Insights
    • Commodities
    • Core Strategies
    • Crypto
    • Direct Indexing
    • Disruptive Technology
    • Energy Infrastructure
    • ETF Building Blocks
    • ETF Education
    • ETF Strategist
    • Financial Literacy
    • Fixed Income
    • Gold/Silver/Critical Minerals
    • Innovative ETFs
    • Institutional Income Strategies
    • Leveraged & Inverse
    • Managed Futures
    • Market Insights
    • Modern Alpha
    • Multifactor
    • Night Effect
    • Portfolio Strategies
    • Responsible Investing
    • Retirement Income
    • Richard Bernstein Advisors
    • Tax Efficient Income
  • Tools
    • ETF Screener
    • ETF Country Exposure Tool
    • ETF Sector Tracker Tool
    • ETF Database Categories
    • Head-To-Head ETF Comparison Tool
    • ETF Stock Exposure Tool
    • ETF Issuer Fund Flows
    • Indexes
    • Mutual Fund To ETF Converter
  • Research
    • ETF Education
    • Equity Investing
    • Dividend ETFs
    • Leveraged ETFs
    • Inverse ETFs
    • Index Education
    • Index Insights
    • Top ETF Sectors
    • Top ETF Issuers
    • Top ETF Industries
  • Webcasts
  • Themes
    • AI ETFs
    • Blockchain ETFs
    • See all Thematic Investing ETF themes
    • ESG Investing
    • Marijuana ETFs
  • Multimedia
    • ETF 360 Video Series
    • ETF of the Week Podcast
    • ETF Prime Podcast
    • Video
  • Company
    • About VettaFi
    • Get VettaFi’ed
  • PRO
    • Pro Content
    • Pro Tools
    • Advanced
    • FAQ
    • Pricing
    • Free Sign Up
    • Login
  1. Financial Literacy Channel
  2. How Do High-Beta and Low-Beta ETFs Differ?
Financial Literacy Channel
Share

How Do High-Beta and Low-Beta ETFs Differ?

Ben HernandezMay 16, 2023
2023-05-16

When an exchange traded fund (ETF) is associated with high or low beta, what exactly does that entail? It all boils down to risk and how much an investor is willing to accept, which is different for everybody.

So in essence, beta is a metric that can measure risk or just how volatile an asset can be relative to the overall market. Volatility is associated with how much the value of an asset can fluctuate, so in terms of ETFs, a high-beta ETF suggests a more volatile fund, and vice versa for a low-beta ETF.

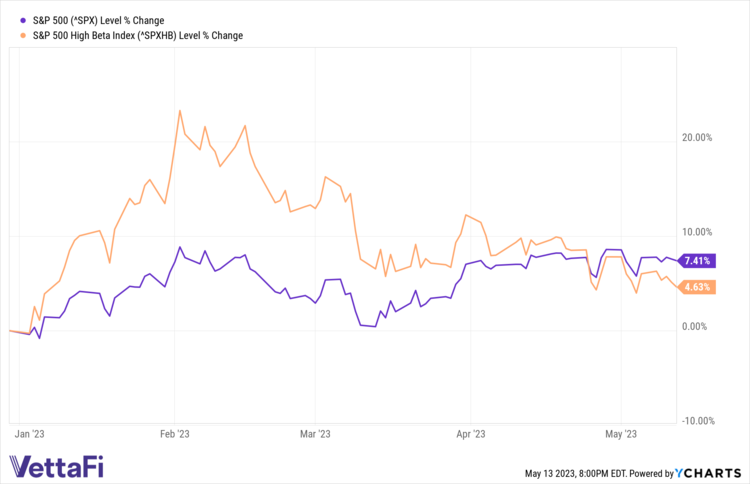
Does the adage of “no risk, no reward” hold up when it comes to high-beta ETFs? In times when the market is rallying, that could be the case. Right now, the S&P 500 is up about 5% and the S&P High Beta Index is up about 7.4%, providing a bit more performance compared the the index sans the high-beta component.

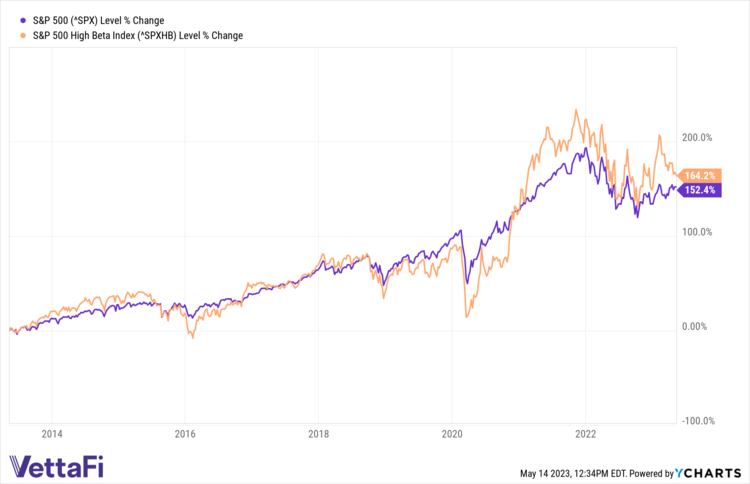
When you stretch out that timeframe to 10 years, the outperformance is still apparent with the high-beta index over 10% higher. As noted in the chart below, however, there are times when the high-beta index outdoes the regular index and when it falls below, which speaks to its higher volatility.

That said, on the opposite end of the spectrum, an ETF identified as low-beta could be ideal for investors who are more risk-averse. A low-beta ETF could be ideal in times when there’s heavy market fluctuations in order to help minimize volatility.

SPX and SPXHB Chart from Ycharts
SPX and SPXHB Level Change Chart

Content continues below advertisement

The VIX: Popular Volatility Measurement

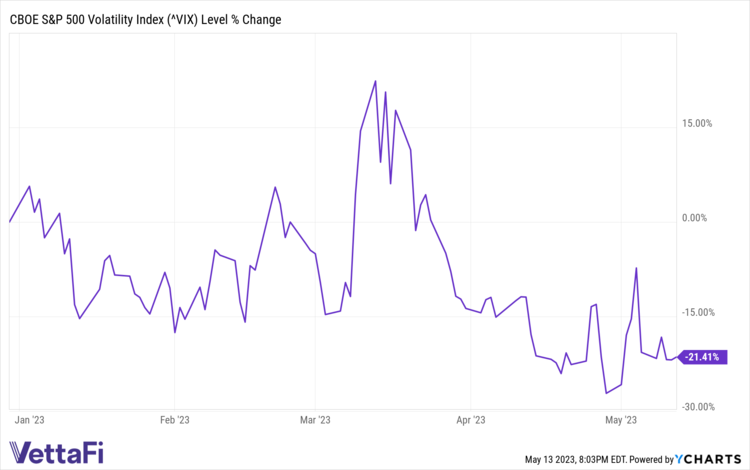
Are there any measurements that investors can use to get a pulse on volatility in the stock market? One popular tool is the CBOE S&P 500 Volatility Index. It’s based on call and put options in the S&P 500, which can give an idea of the 30-day expected volatility of the index.

So far for the year, the VIX has been lower versus last year when it registered a 33.4 reading on April 29, 2022. At that time, inflation fears and rising interest rates were spooking investors. Those factors still remain, but to a lesser degree as optimism around fewer rate hikes by the Federal Reserve is giving investors some hope.

Of course, that could all change if economic data suggests that a recession could be forthcoming. There could be other events that could spark more volatility that are unforeseen, just like Russia’s invasion of Ukraine last year.

Either way, the VIX can give investors a snapshot on the level of volatility in the stock market, or at least the S&P 500. They can use this as a gauge to decide whether the market is calm enough to enter or to exit, stay tight, or add hedging positions if things get too rocky.

VIX Level Percent Change Chart

For more news, information, and analysis, visit the Financial Literacy Channel.

Loading Articles...
Our Sites
  • VettaFi
  • Advisor Perspectives
  • ETF Trends
Tools
  • ETF Screener
  • Mutual Fund to ETF Converter
  • Head-To-Head ETF Comparison
  • ETF Country Exposure Tool
  • ETF Stock Exposure Tool
  • ETF Database Pro
More Tools
  • Financial Advisor & RIA Center
Explore ETFs
  • ETF News
  • ETF Category Reports
  • Premium Articles
  • Alphabetical Listing of ETFs
  • Browse ETFs by ETF Database Category
  • Browse ETFs by Index
  • Browse ETFs by Issuer
  • Compare ETFs
Information
  • Contact Us
  • Terms of Use and Privacy Policy
  • © 2023 VettaFi LLC. All rights reserved.

Advertisement

Is Your Portfolio Positioned With Enough Global Exposure?

ETF Education Channel

How to Allocate Commodities in Portfolios

Tom LydonApr 26, 2022
2022-04-26

A long-running debate in asset allocation circles is how much of a portfolio an investor should...

Core Strategies Channel

Why ETFs Experience Limit Up/Down Protections

Karrie GordonMay 13, 2022
2022-05-13

In a digital age where information moves in milliseconds and millions of participants can transact...

}
X