

The fixed income asset class has been anything but sleepy thus far this year. In fact, fixed income investors may be experiencing bouts of insomnia as higher-for-longer interest rates and a new Fed chair continue to add uncertainties.
In the latest webinar episode of Gundlach Unlocked, the Bond King and DoubleLine CEO, Jeffrey Gundlach, outlined the prospective lay of the land for the second half of 2026. Much of that is how to navigate an environment dominated by an elevated interest rate regime. Gundlach referenced historical data spanning decades, and cited striking parallels between the current macro environment of 2026 and historical periods of market euphoria. Summarily, it served as a prospective warning that resonates across both fixed income and speculative equity sectors.
Key Takeaways:
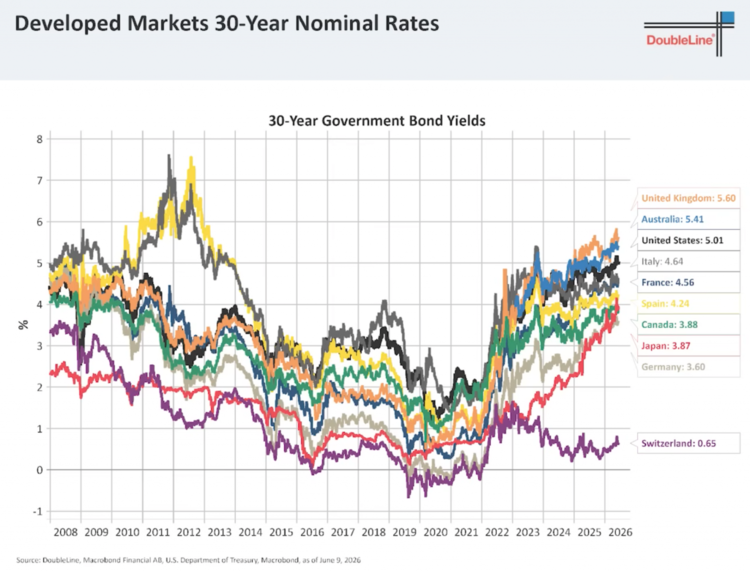
- The Bond King warns investors to avoid long-term government bonds in developed nations. He noted that unadjusted inflation metrics sit around 6.5% and the Fed is far more likely to hike rates than cut them in 2026.
- U.S. stock market concentration has hit a critical bottleneck similar to the 2000 Dot-com bubble peak. Currently, only 10 dominant technology and AI companies are commanding 41% of the entire S&P 500 market capitalization.
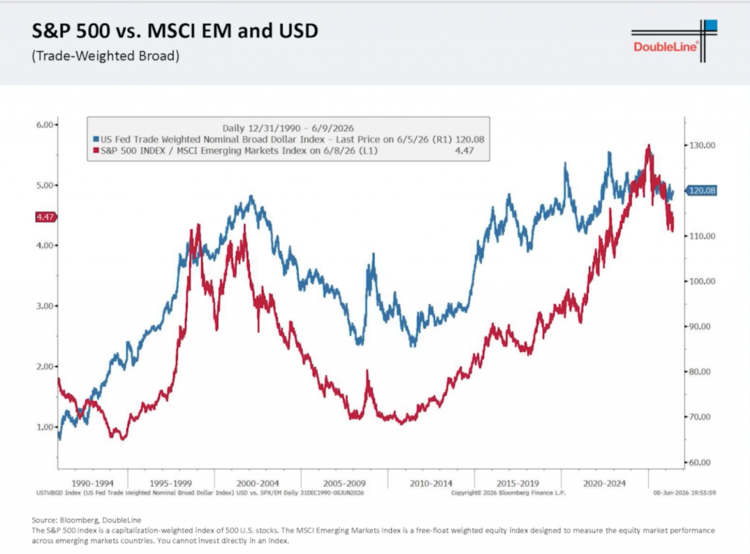
- Driven by a structurally weakening U.S. dollar, Gundlach urges a geographic rotation away from top-heavy domestic tech indexes and toward international assets, emerging market equities, and local-currency EM debt.
See more: Core Alpha, Mass Scale: How Capital Group Shifted the Active ETF Playbook
Fixed Income's Structural Reality
Gundlach began the discussion with an analysis of the structural evolution of the fixed income landscape, namely through the Bloomberg U.S. Aggregate Bond Index. He noted an uncanny mathematical anomaly where the index’s 10- and 20-year yield-to-worst averages sit within a single basis point of each other. Further out on the yield curve, the 30-year historical average hovers at a modest 4.05%.
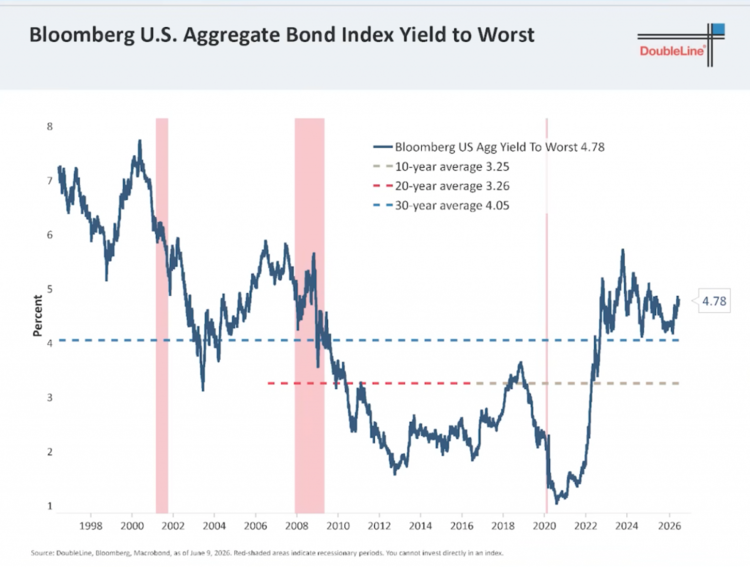
“You have to remember that we had about 15 years of financial suppression, with zero interest rates,” Gundlach explained. “They remained at zero for so long that they ended up ushering in the era of money printing, particularly advanced by the COVID lockdown that led to a surge in inflation.”
With the Aggregate Index yield at 4.78%, Gundlach pointed out that nominal bond metrics have retraced to levels not seen since the 2008 financial crisis. Fast forward 12 years later, investors who locked in a 1% yield on the 30-year U.S. Treasury Bond in 2020 suffered capital drawdowns that exceeded 52% during 2022. A time when high rates applied downward pressure on both bonds and equities. Given the data, Gundlach reiterated a decree: avoid long-term government bonds in developed countries.
The Fed and the Illusion of Cuts
Follow the two-year Treasury curve. This is a core pillar of Gundlach’s thesis where historical data shows the U.S. Federal Reserve is dependent on the front end of the curve. Whenever the two-year Treasury yield shifts, the federal funds rate moves after it, which leaves monetary policymakers well behind the curve during inflection points.
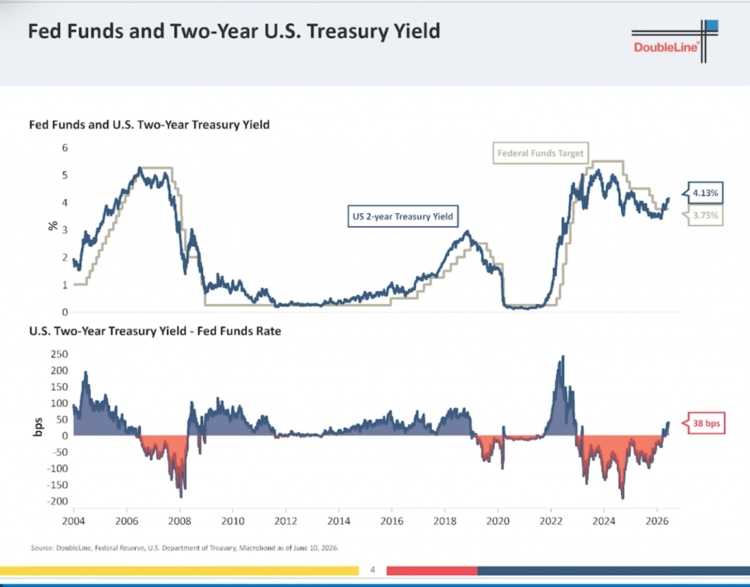
“I always say that the Fed follows the two-year Treasury,” Gundlach remarked, tracing the correlation to the federal funds target back to 2004.
He also cited 2022 as a prime example of the Fed’s sluggish response to the post-pandemic inflation spike. Recalling Jerome Powell’s late liftoff of interest rates in 2022, Gundlach was roundly criticized by his peers.
“The Fed should not have raised rates 25 basis points today,” Gundlach said during that time. “They should have raised them 200 basis points today. And everyone gasped when I said that, but lo and behold, we see that the Fed had to raise interest rates by 200 basis points in the ensuing couple of meetings.”
Persistent Inflation's Inevitable Outcome
Heading into 2026, the capital markets were expecting more rate cuts after ending 2025 with two consecutive rate cuts (four total for the year). This year, the Fed could be headed for an about-face on easing as persistent inflation continues to rack the markets. Needless to say, Fed Chair Kevin Warsh has his work cut out for him.
Gundlach reinforced the narrative of today’s rising interest rates by mentioning persistent, underlying inflationary metrics. However, he dismissed engineered metrics like the Dallas Fed’s Trimmed Mean PCE as “cynical exercises.” He said that they’re designed to understate inflation by heavily dropping the highest price inputs while retaining lower ones. Instead, Gundlach favors raw, unadjusted metrics like import and export price indexes, which currently reveal a staggering 6.5% inflation rate. When the proverbial cream is removed from the coffee, the truth reveals itself. In this case, it’s the truth that rates could be elevated for some time.
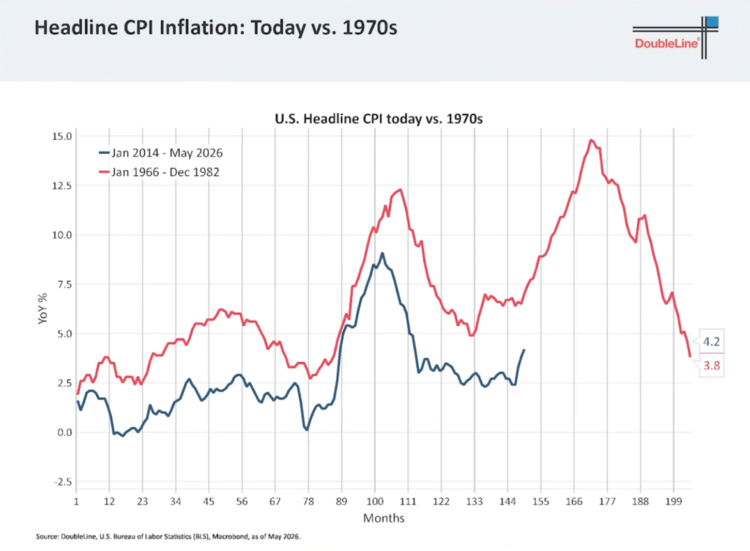
“At this point, I think there’s no chance that they’re gonna cut rates in 2026," Gundlach said. “In fact, if I had to bet, I would bet they would hike them.”
The Hype Cycle and Global Rotation
Moving on to equities, Gundlach warned of extreme asset concentration and overvaluation. The Shiller PE (CAPE) ratio has already climbed to historic highs, matching the peaks of the Dot-com bubble. This peak coincides with the massive wave of mega-cap initial public offerings (IPOs) in highly speculative segments. Of course, SpaceX comes to mind as an often-circulated name in financial news headlines.
“It’s suggestive of a hype cycle on steroids similar to the hype cycle on steroids of the year 2000,” Gundlach said.
This concentration has reached a critical bottleneck, with just 10 dominant tech and artificial intelligence (AI) names commanding 41% of the entire S&P 500 market capitalization. Gundlach noted that this ratio has already begun to reverse, indicating that the top may have already been breached.
Given the outperformance of U.S. equities relative to the rest of the world in the past decade, Gundlach urged a structural asset allocation pivot. Driven by a structurally weakening, trade-weighted U.S. dollar, emerging markets (EM) equities and local-currency EM debt have steadily outpaced domestic benchmarks over the past 18 months. For forward-thinking investors looking to play defense, rotating capital away from top-heavy domestic tech indexes and toward international, cash-flow-generative assets is an ideal move for the second half of the year and potentially beyond.
To view the full webinar, click below:
Originally published on Advisor Perspectives.
For more news, information, and analysis, visit the Fixed Income Content Hub.

