

Three years after its June 21, 2023, inception, the VictoryShares Free Cash Flow ETF (VFLO ) has grown to more than $7.5 billion in AUM as of June 22, 2026. Three years is the threshold at which some institutional screeners and due diligence frameworks begin evaluating a fund. VFLO crossed it with scale, having attracted more than $7.5 billion in assets while compiling a verifiable live-market record.
The ETF tracks the Victory U.S. Large Cap Free Cash Flow Index (the “Index”), which was built on a straightforward premise: free cash flow (FCF), the remaining cash a company has after covering all expenses. It can be used to invest in growing the business, pay dividends, or pay down debt.
How Does VFLO's Index Screen Stocks?
VFLO has established itself as a core option for large-cap value allocation, built on the premise that a disciplined focus on FCF generation is a more durable signal of company quality than traditional accounting-based value metrics. Traditional value strategies often rely on metrics that are prone to accounting manipulation. VFLO uses FCF because, unlike earnings-based measures, it is harder to influence through accounting choices and reflects cash actually generated.
The Index screens the U.S. large-cap universe for companies with high expected FCF yield and strong fundamental growth.
The methodology has two distinguishing features. First, it uses Expected FCF, the average of a company’s trailing 12-month and forward 12-month FCF, rather than purely historical numbers. Second, it uses enterprise value (a company’s market cap plus debt, less cash) rather than market cap as the denominator for FCF yield, a choice that favors companies with lower net debt.
After the Index identifies its selection of stocks ranked by their highest FCF yields, a growth filter is applied because companies with structurally declining businesses typically also have shown weak forward growth. The filter screens both conditions in one step. This step screens out companies whose low valuations may reflect deteriorating fundamentals, and is designed to produce a focused 50-stock, high-quality portfolio.
See More: Why Stock Buyback Leaders Are Screening Into the VictoryShares Free Cash Flow ETF
This approach is supported by Penman & Reggiani (2018), who studied 176,848 US non-financial companies from 1963–2015 and found that high-yield stocks with weak profitability carried a significantly greater risk of earnings growth failing to materialize. This underscored why we believe a forward growth filter is a critical complement to any yield-based selection process. (Financial Analysts Journal, Vol. 74, No. 4).
The Index also excludes the Financials and Real Estate sectors, where banking and insurance balance-sheet structures can distort cash flow metrics, and REITs are evaluated on FFO/AFFO rather than FCF. That leaves VFLO positioned in sectors such as Information Technology (23.00%), Energy (22.80%), and Healthcare (20.56%) as of June 19, 2026. For a full sector breakdown, see the end of the article.
Three Years of VFLO: What the Methodology Has Held Up Through
A verifiable track record matters when evaluating an ETF’s methodology. VFLO has built that record over three years, applying its rules-based methodology in live markets.
For wealth managers and retail investors, the strategy offers an FCF mandate within an ETF structure, screening for companies that have funded their own operations, grown dividends, and repurchased shares, all within the structural features of an ETF wrapper. As VFLO enters its fourth year, its core thesis still applies: in today’s complex macroeconomic environment, the Index focuses on a company’s ability to generate FCF.
Source: Forward P/E and weight in Mag 7 sourced from FactSet, all other metrics from Bloomberg. Index returns are for illustrative purposes only and do not represent actual Fund performance. Index performance does not reflect management fees, transaction costs or expenses. Indexes are unmanaged and one cannot invest directly in an index. Past performance does not guarantee future results *Expected FCF is the average of trailing 12-month FCF and next 12-month forward FCF. The Mag 7 consists of Alphabet (GOOGL; GOOG), Amazon (AMZN), Apple (AAPL), Meta Platforms (META), Microsoft (MSFT), NVIDIA (NVDA), and Tesla (TSLA).
VFLO Performance (%) as of 6/30/2026
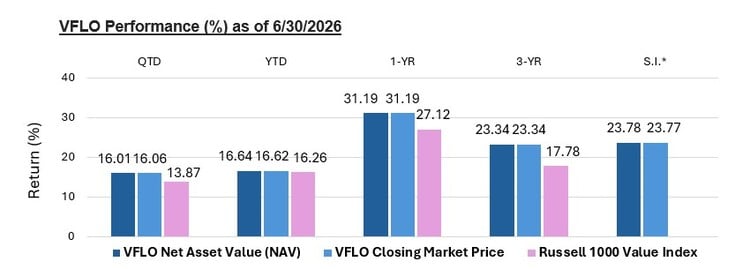
Past performance does not guarantee future results. The performance data quoted represents past performance and current performance may be lower or higher. The investment return and principal value will fluctuate so that an investor’s shares, when redeemed, may be worth more or less than the original cost. To obtain performance information current to the most recent month-end, visit www.victoryshares.com. ETF shares are bought and sold at market price (not NAV) and are not individually redeemed from the Fund. Brokerage commissions will reduce returns. Market price returns are based on the price of the last reported trade on the Fund’s primary exchange. If you trade your shares at another time, your return may differ. Returns include reinvestment of dividends and capital gains. Performance for periods greater than one year is annualized. Performance may reflect certain past fee waivers and/or expense reimbursements, without which performance would have been lower. Index performance includes reinvestment of dividends and other income but does not reflect management fees, transaction costs or other expenses.
VFLO Sector Weights as of 6/30/2026
For more news, information, and analysis, visit the Free Cash Flow Content Hub
VettaFi LLC (“VettaFi”) is the index provider for VFLO, for which it receives an index licensing fee. However, VFLO is not issued, sponsored, endorsed, or sold by VettaFi, and VettaFi has no obligation or liability in connection with the issuance, administration, marketing, or trading of VFLO.
Disclosure Information
Carefully consider a fund’s investment objectives, risks, charges, and expenses before investing. To obtain a prospectus or summary prospectus containing this and other important information, visit http://www.vcm.com/prospectus. Read it carefully before investing.
All investing involves risk, including the potential loss of principal. The Fund has the same risks as the underlying securities traded on the exchange throughout the day. ETFs may trade at a premium or discount to their net asset value. The market prices of securities may go up or down, sometimes rapidly or unpredictably, due to general market conditions, such as real or perceived adverse economic, political, or regulatory conditions, recessions, inflation, or changes in interest or currency rates. Investing in companies with high free cash flows could lead to underperformance when such investments are unpopular or during periods of industry disruptions. The Fund could also be affected by company-specific factors that could jeopardize the generation of free cash flow. Index Funds invest in securities included in, or representative of securities included in, the Index, regardless of their investment merits. The performance of the Fund may diverge from that of the Index. Large shareholders, including other funds advised by the Adviser, may own a substantial amount of the Fund’s shares. The actions of large shareholders, including large inflows or outflows of cash, may adversely affect other shareholders, including potentially increasing capital gains. Investments concentrated in an industry or group of industries may face more risks and exhibit higher volatility than investments that are more broadly diversified over industries or sectors. Investments in companies in the energy sector may be subject to substantial government regulation, as well as risks involving changes in energy prices, international political instability, and liability for environmental damage and accidents resulting in loss of life or property. The profitability of companies in the healthcare sector may be affected by government regulations and healthcare programs, fluctuations in the cost of, and demand for, medical products and services and product liability claims. Derivatives may not work as intended and may result in losses. The Fund may frequently change its holdings, resulting in higher fees, lower returns, and more capital gains. The value of your investment is also subject to geopolitical risks such as wars, terrorism, trade disputes, environmental disasters, and public health crises; the risk of technology malfunctions or disruptions; and the responses to such events by governments and/or individual companies.
The Victory U.S. Large Cap Free Cash Flow Index aims to select high-quality companies from its starting universe by applying profitability screens. It then selects companies with the strongest free cash flow yield that exhibit higher growth. The Index is rebalanced and reconstituted quarterly. This Index calculates free cash flow yield by dividing expected free cash flow by enterprise value. Expected free cash flow is the average of trailing 12-month FCF and next 12-month forward free cash flow.
Enterprise value (EV) measures a company’s total value, often used as a more comprehensive alternative to equity market capitalization. Standard deviation is a common measure of risk that indicates the historical volatility of a portfolio. Beta measures the price volatility, or the level of risk, of a stock relative to the broader market. A beta of 1 indicates that the security’s price has moved with the market. A beta of less than 1 means that the security has been less volatile than the market. A beta of greater than 1 indicates that the security’s price has been more volatile than the market. Average P/E Ratio (estimated or next 12 months “NTM”) is the current price of a stock divided by the estimated one-year projection of its earnings per share. Free cash flow yield is the ratio of a company’s free cash flow per share to its current EV. Forward P/E indicates how much investors are paying today for every dollar of earnings expected over the next year. A higher number means the market is pricing in strong future growth; a lower number suggests modest growth expectations, or a potentially cheap stock. The Russell 1000® Index Value Index is a market-capitalization-weighted index that measures the performance of Russell 1000® Index companies with lower price-to-book ratios and lower forecasted growth rates. The S&P 500® Index is a market-capitalization-weighted index that measures the performance of the common stocks of 500 leading U.S. companies. The Russell 1000® Growth Index is a market-capitalization-weighted index that measures the performance of Russell 1000®Index companies with higher price-to-book ratios and higher forecasted growth values. The MSCI USA Sector Neutral Quality Index is a large- and mid-cap US equity index that identifies stocks exhibiting stronger quality characteristics relative to their peers within the same GICS sector, scored on three fundamental variables: high Return on Equity (ROE), low leverage, and low earnings variability.
VictoryShares ETFs distributed by Victory Capital Services, Inc. (VCS). VCS is not affiliated with VettaFi.
©2026 Victory Capital Management Inc. All Rights Reserved.
20260626-5644796

