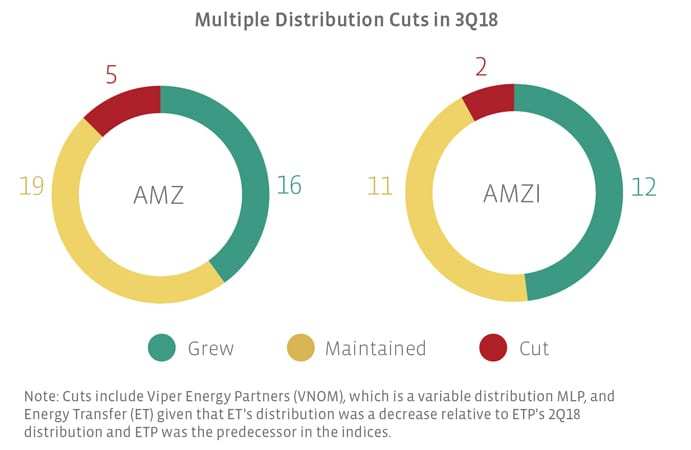
AMZ and AMZI constituent Buckeye Partners (BPL) cut its distribution by 41% with the conclusion of its strategic review. Along with other actions, the distribution cut is intended to support financial flexibility and maintenance of the firm’s investment grade rating by allowing for debt reduction. Energy Transfer Equity (former ticker ETE) acquired Energy Transfer Partners (former ticker ETP) in October, ahead of the 3Q18 distribution announcement. The surviving entity in the indices is Energy Transfer LP (ET), and its distribution was compared to the 2Q18 distribution for ETP, which was ET’s predecessor in the indices. The result is a backdoor cut. Three other AMZ constituents announced distribution cuts. Golar LNG Partners (GMLP) reduced its distribution by 30%, while variable distribution MLP Viper Energy Partners (VNOM) reported a 3% cut. Hi-Crush Partners (HCLP) decreased its distribution by 70%, after a 233.3% increase with its 2Q18 distribution. An IDR reset provision had motivated the jump in the distribution to $0.75 per unit for 2Q18, but HCLP acquired its general partner in October, eliminating its IDRs and rendering the IDR reset moot. The 3Q18 distribution of $0.225 per unit is intended to align the payout with that of a growth-focused corporation, as HCLP progresses toward corporate conversion.
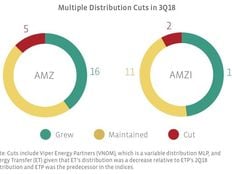
Notable Q/Q data points for the AMZ and AMZI
Dropdown MLP BP Midstream Partners (BPMP) led the AMZ with the highest sequential increase, raising its distribution by 7.0% sequentially to $0.29 per unit. For the fifth straight quarter, Antero Midstream Partners (AM) was the leader in the AMZI, increasing its distribution by 6.0% to $0.44 per unit. Other constituents with increases greater than 5% were Phillips 66 Partners (PSXP) with a 5.3% increase and Dominion Midstream Partners (DM) with a 5.1% increase. Rounding out the more notable growers, Shell Midstream Partners (SHLX) and Noble Midstream Partners (NBLX) both saw sequential growth of 4.7%.
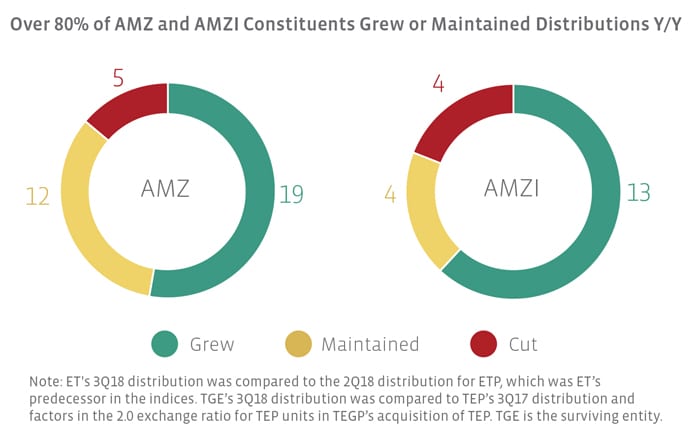
Most constituents grew distributions year-over-year
The charts below compare the 3Q18 distribution with the 3Q17 distribution for those names that were in the index in both periods. Please note that this method introduces survivorship bias.


Names that maintained their distribution in 3Q18 relative to 3Q17 include (names with an asterisk are also in the AMZI):
AmeriGas Partners(APU)- Crestwood Equity Partners(CEQP)
- DCP Midstream(DCP)
- Enbridge Energy Partners(EEP)
- Enable Midstream Partners(ENBL)
- EnLink Midstream Partners(ENLK)
- NGL Energy Partners(NGL)
- *Plains All American Pipeline (PAA)
Suburban Propane Partners (SPH)
Summit Midstream Partners(SMLP)
Sunoco(SUN)
Teekay LNG Partners(TGP)
USA Compression Partners (USAC)
Constituents with a year-over-year decrease in distributions include NuStar Energy (NS), TC Pipelines (TCP), BPL, GMLP, and ET. The 3Q17 distribution cuts from PAA, GEL and SPH have now rolled off, with SPH and PAA holding steady y/y and GEL growing.
Distribution growth will continue to shift
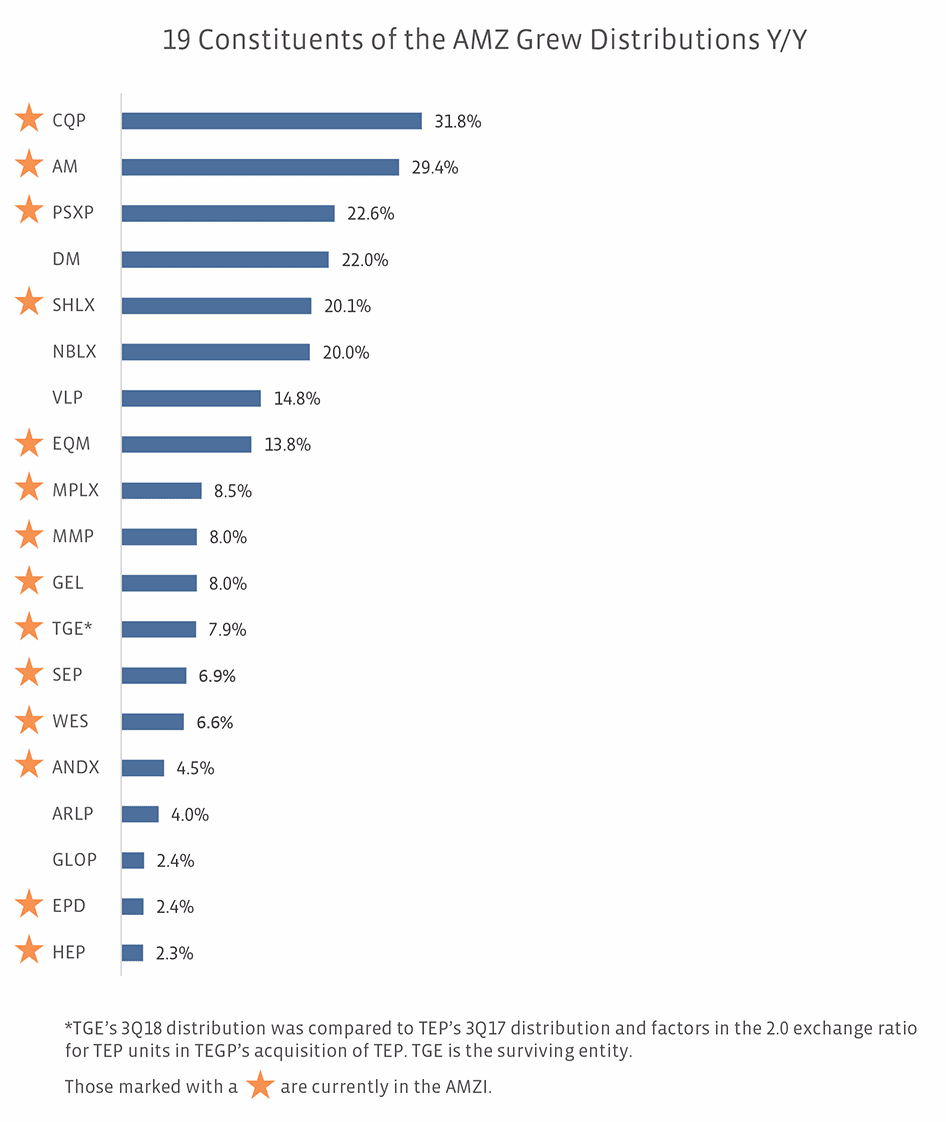
The year-over-year chart reveals a considerable bias towards dropdown MLPs among the double-digit growers (AM, PSXP, DM, SHLX, NBLX, VLP and EQM). For many of these names, higher distribution growth is driven by their parent’s incentive distribution rights (IDRs). All of the double-digit growers have IDRs, though DM previously executed an IDR reset. As we discussed last week in our post on dropdown MLPs (read more), we would expect dropdown MLPs to pursue IDR eliminations over time, adhering to investor preferences and following in the footsteps of other MLPs that have eliminated IDRs (read more).
Slower distribution growth is not just a potential product of IDR elimination. The growth profile of distributions will also change as some of the high growth names in the indices get acquired. Already, transactions for AM, DM, Valero Energy Partners (VLP), Spectra Energy Partners (SEP), and Western Gas Partners (WES) are pending closure. As of the October 19th special rebalancing, these MLPs had a combined weighting of 9.2% in the AMZ Index, with DM and VLP at less than 1% each. For the AMZI, the combined weighting of AM, SEP, and WES was 9.5%. While the loss of these growers may seem significant on the surface, their modest weightings in the AMZ and AMZI help mute the overall impact from an index perspective. In that vein, the backdoor cut from ET, which has a 10% weighting in both indices, likely had a larger impact.
Some MLP management teams have also lowered their distribution growth as part of a strategic shift. Given that markets have only modestly rewarded MLPs for their distribution growth, some companies are redirecting cash towards organic growth projects (self-funding equity) and/or are discussing potential unit buybacks. On the company’s 3Q earnings call, ET Chairman and CEO Kelcy Warren discussed the potential for distribution increases or buybacks depending on what is being rewarded by the market. Similarly, GEL Chairman and CEO Grant Sims responded to a question on distribution growth citing the need to decide the highest value use of incremental capital, and in responding to a follow-up question on buybacks, he acknowledged that buybacks were a potential use of excess cash. In short, if distribution growth is not being rewarded, MLPs may shift to use that money elsewhere, with buybacks a potential means for supporting unit prices.
Bottom Line
The pool of constituents growing their distributions in the double-digits is likely going to continue shrinking. The shifting focus for MLPs is adhering to a distribution policy that is sustainable and supportive of changing capital allocation needs. While that may mean more moderate distribution growth going forward, benefits like higher coverage ratios, lower leverage ratios, and less reliance on equity capital markets should be welcomed by MLP investors (and generalist investors).

