ETFdb Logo
ETFdb Logo
  • ETF Database
  • Channels
    • Active ETF
    • Alternatives
    • Beyond Basic Beta
    • China Insights
    • Climate Insights
    • Commodities
    • Core Strategies
    • Crypto
    • Disruptive Technology
    • Dividend
    • Dual Impact
    • Emerging Markets
    • Energy Infrastructure
    • ESG
    • ETF Building Blocks
    • ETF Education
    • ETF Strategist
    • Fixed Income
    • Free Cash Flow
    • Future ETFs
    • Global Diversification
    • Gold & Silver Investing
    • Innovative ETFs
    • Institutional Income Strategies
    • Leveraged & Inverse
    • Managed Futures
    • Market Insights
    • Megatrends
    • Modern Alpha
    • Multi-Asset
    • Night Effect
    • Portfolio Strategies
    • Retirement Income
    • Richard Bernstein Advisors
    • Tax Efficient Income
    • Thematic Investing
    • Volatility Resource
  • Tools
    • ETF Screener
    • ETF Country Exposure Tool
    • ETF Sector Tracker Tool
    • ETF Database Categories
    • Head-To-Head ETF Comparison Tool
    • ETF Stock Exposure Tool
    • ETF Issuer Fund Flows
    • Indexes
    • Mutual Fund To ETF Converter
    • ETF Data for Journalists
    • ETF Nerds
  • Research
    • First Bitcoin ETF
    • ETF Education
    • Equity Investing
    • Dividend ETFs
    • Leveraged ETFs
    • Inverse ETFs
    • Index Education
    • Index Insights
    • Top ETF Sectors
    • Top ETF Issuers
    • Top ETF Industries
  • Webcasts
  • Themes
    • AI ETFs
    • Blockchain ETFs
    • See all Thematic Investing ETF themes
    • ESG Investing
    • Marijuana ETFs
  • Multimedia
    • ETF 360 Video Series
    • ETF Trends on Videos
    • ETF Trends on Podcasts
    • ETF Prime Podcast
  • Company
    • About Us
    • Swag Store
  • PRO
    • Pro Content
    • Pro Tools
    • Advanced
    • FAQ
    • Pricing
    • Free Sign Up
    • Login
  1. Index Insights
  2. 4Q19 Midstream Distribution Coverage and Payout Ratios: Comfort Amid Macro Headwinds
Index Insights
Share

4Q19 Midstream Distribution Coverage and Payout Ratios: Comfort Amid Macro Headwinds

Michael LaitkepMar 02, 2020
2020-03-02

Summary //

  • Higher distribution coverage ratios can give investors comfort around the ability of MLPs to afford their distributions and reflect the greater resilience of MLPs after years of improvements.
  • For 4Q19, average distribution coverage for the AMZI was 1.5x, which implies a 50% cushion between cash coming in and cash being paid out.
  • The average payout ratio for the AMZI in 2019 was 65%, while the average for the AMEI was 62%, with nearly half of the companies analyzed (15 out of 33 names) paying out less than 60%.

While Treasury yields have been plunging, midstream yields have been heading higher as broader energy and market concerns stemming from the coronavirus weigh on midstream equity values. As of Friday, the Alerian MLP Infrastructure Index (AMZI) and the Alerian Midstream Energy Select Index (AMEI) were yielding 10.5% and 7.5%, respectively. For investors looking for yield or who are already invested in midstream for its income, the sustainability of midstream payouts is likely in focus as yields that high can seem too good to be true. Having recapped 4Q19 MLP distributions last week and previously discussing 2020 dividend guidance in January, this week’s piece gauges the health of midstream distributions/dividends through the analysis of distribution coverage and payout ratios. Payout ratios are shown alongside distribution coverage to provide a more familiar metric for generalist investors. Today, we focus on full-year and 4Q19 distribution coverage trends for the AMZI and incorporate payout ratios for both the AMZI and the AMEI, which includes corporations, with the goal of providing some peace of mind around midstream yields.

Solid MLP distribution coverage provides comfort amid macro headwinds.
In recent days, the energy sector has not been spared as the spread of novel coronavirus has spooked broader markets and sent commodity prices tumbling on concerns about weaker demand. Year-to-date through February 28, WTI crude is down more than 25%, and broad market indexes have entered correction territory, decreasing almost 10% since their relative peak in mid-February. MLPs, represented by the AMZI Index, are down 21.1% on a price-return basis, while midstream, represented by the AMEI Index, has fallen 15.1%. This performance comes in the midst of a mixed to positive 4Q19 earnings season for most constituents, with larger names in the space generally reporting results ahead of expectations and providing solid forward guidance.

Given midstream’s participation in the broader market sell-off, it is important to revisit the financial footing of the space, specifically by looking at distribution coverage and payout ratios. Distribution coverage is the primary way to measure the ability of MLPs to afford their distributions and represents the cushion between cash flow being generated and cash being paid out as distributions to unitholders. The greater the cushion, the more comfort investors can have. Distribution coverage for the constituents of the AMZI has generally improved year-over-year and in the last few years thanks to lessons learned from the oil downturn in 2014-16 and a number of corresponding improvements, discussed more below. For 4Q19, average distribution coverage for the AMZI was 1.5x, which implies a 50% cushion between cash coming in and cash being paid out. Current coverage is even with the average coverage ratio of 1.5x in 4Q18 and a step up from average coverage of 1.2x in 4Q16. Overall, 14 of the 18 AMZI constituents analyzed had distribution coverage ratios of 1.2x or better in 4Q18.

This is the image alt text

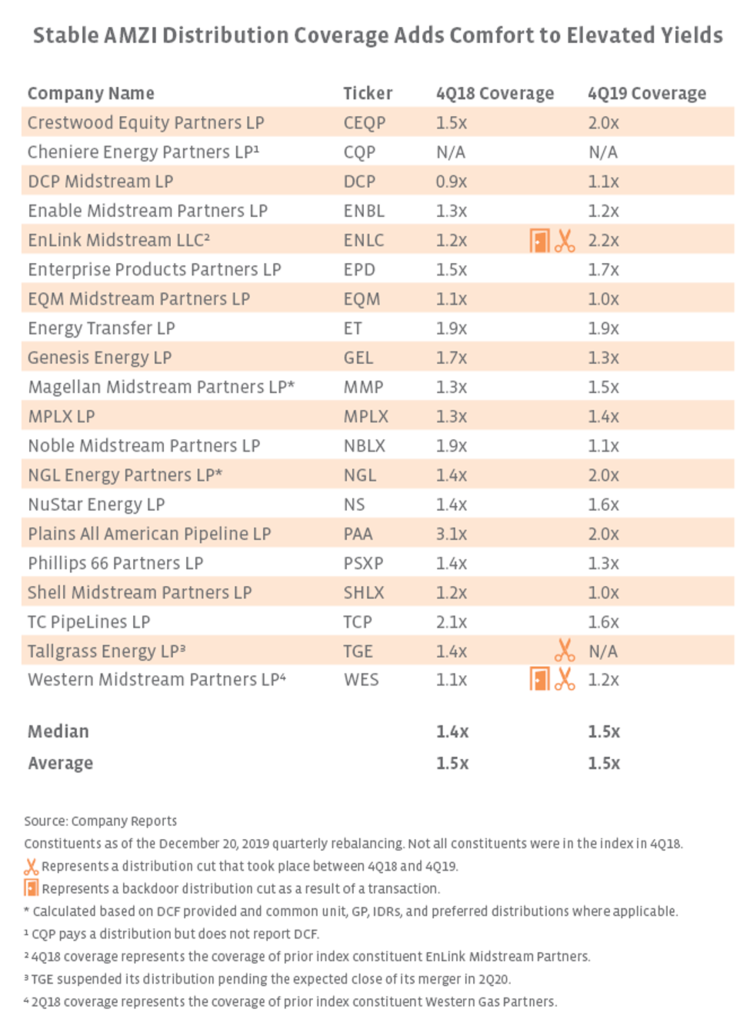
MLPs have made numerous improvements over the last few years that have led to healthier coverage ratios. An emphasis on sustainable distributions, retaining cash flow to fund growth capital spending, and eliminating incentive distribution rights (IDRs) has improved the financial flexibility of MLPs, which is especially beneficial given recent volatility. Furthermore, declining growth capex should support greater free cash flow generation after years of hefty spending to facilitate the boom in US energy production (read more). Reduced leverage has also improved financial flexibility. Despite high yields resulting from the market sell-off in February, increasing distribution coverage should help reassure investors regarding the quality and stability of MLP distributions. As of February 28, the AMZI Index was yielding 10.5%, 260 basis points above its three-year average of 7.9%. Overall, distribution coverage looks comfortable for AMZI constituents.

What’s driving recent changes in distribution coverage at the company level?
Distribution coverage has fluctuated over the last few years for different company-specific reasons, with cuts helping in some cases. EnLink Midstream’s (ENLC) coverage jumped to 2.2x following a 33.7% distribution cut in 4Q19 and a backdoor cut in 1Q19. This week, EQM Midstream Partners (EQM) announced it would be acquired by Equitrans Midstream (ETRN) in a share-for-unit transaction expected to close in mid-2020. EQM and ETRN will cut their dividends in 1Q20 by 66.6% and 66.7%, respectively, to accelerate deleveraging. Notably, these cuts are already reflected in the yields cited for the AMZI and AMEI. Noble Midstream Partners (NBLX), Shell Midstream Partners (SHLX), and Plains All American Pipeline (PAA) have seen their distribution coverage drop year-over-year after growing their distributions by 17% or more over 4Q18. NBLX guided to increased distribution coverage of 1.3x at the midpoint in 2020, while PAA expects coverage to fall to 1.6x as a result of lower distributable cash flow driven by lower Supply and Logistics earnings (read more). SHLX had the lowest coverage at 1.0x in 4Q19 as a result of IDRs and double-digit percentage distribution growth, but last week, SHLX announced an IDR elimination and dropdown transaction. Western Midstream (WES) is guiding to slightly higher distribution coverage of 1.3x in 2020 as its distribution growth slows to 1% year-over-year from more than 5% in 2019. Crestwood Equity Partners (CEQP) has seen substantial improvement of its coverage from 1.5x in 4Q18 to 2.0x in 4Q19, and it expects to maintain that level this year.

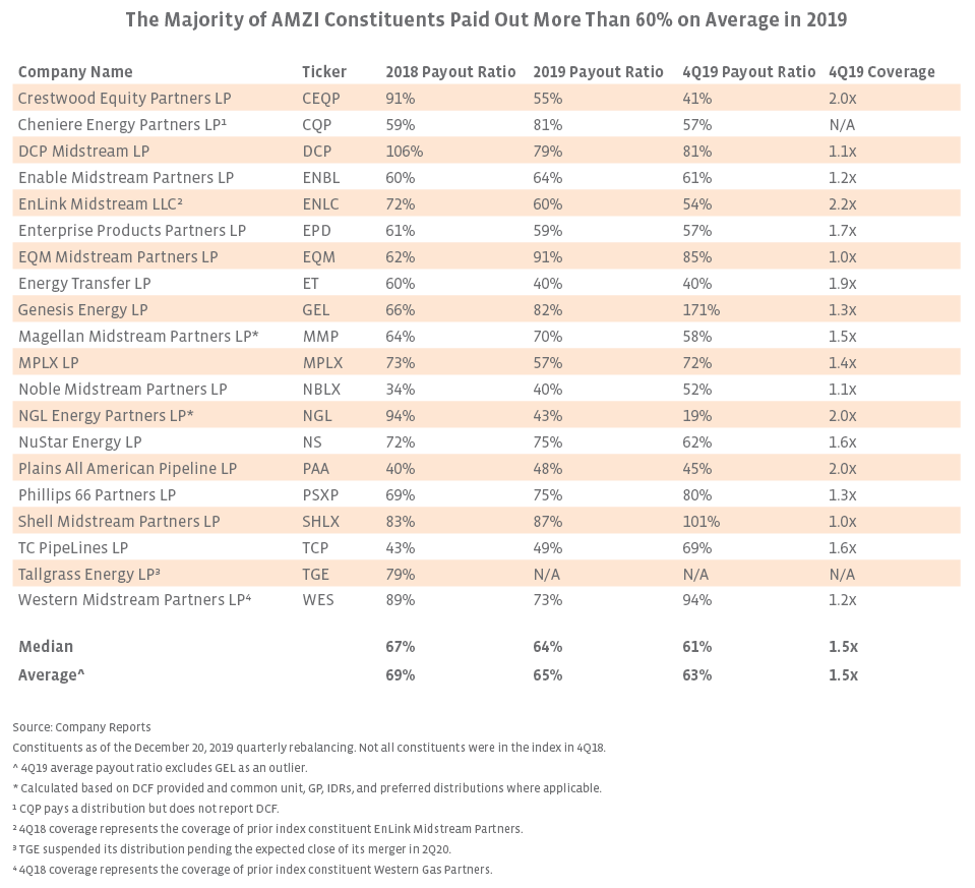
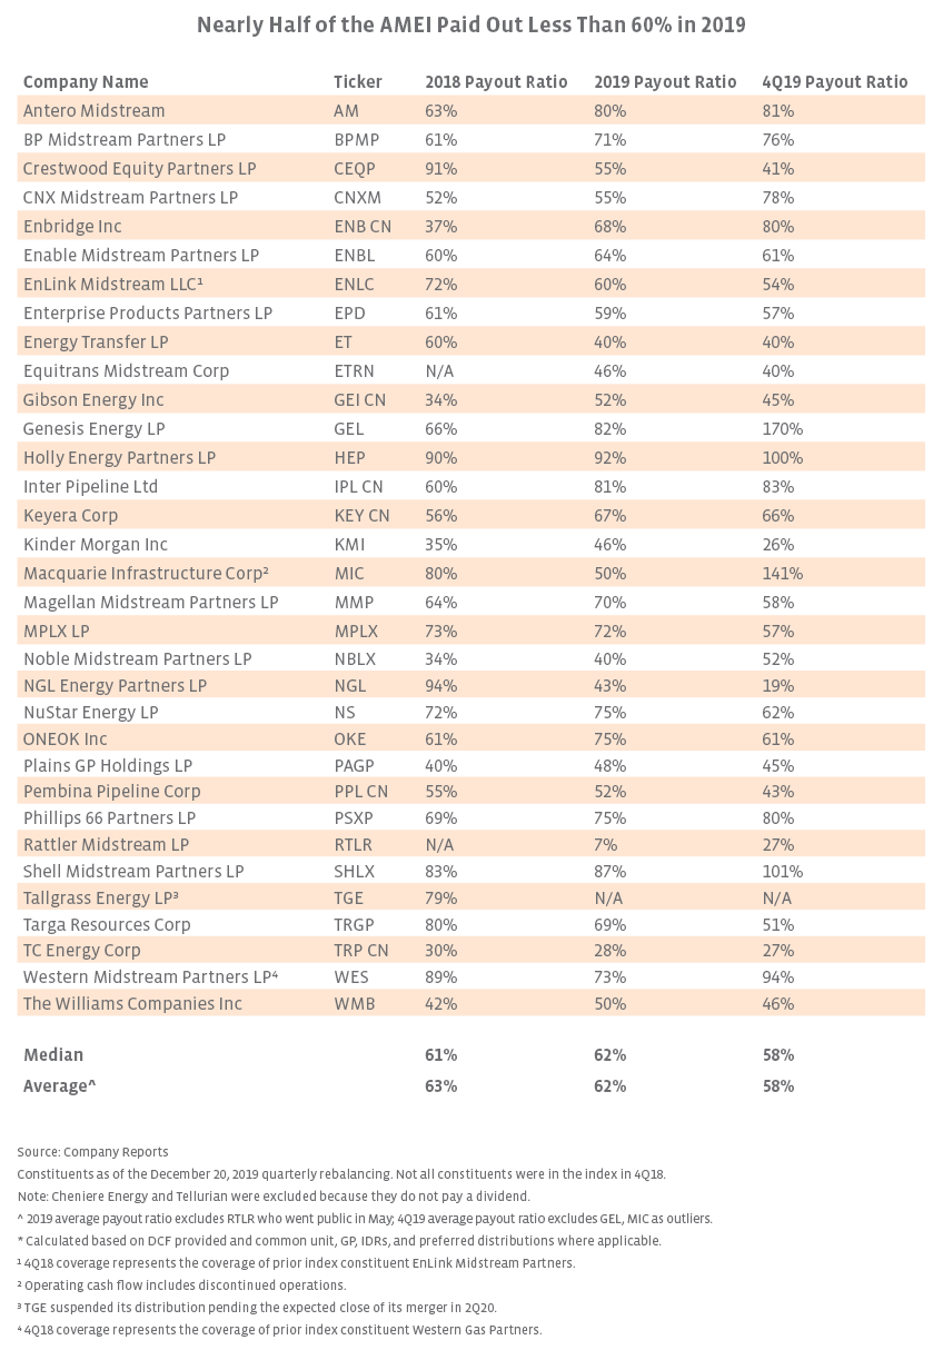
MLP and midstream payout ratios remain healthy.
In an effort to provide more generalist-friendly metrics, we continue to highlight payout ratios for AMZI constituents, and this time, we add in payouts for the MLP and C-Corp constituents of the AMEI Index. For the calculation of payout ratios, we compared distribution/dividend payments (including payments for preferred units and payments to the general partner where applicable) to operating cash flow. Operating cash flow was used since earnings for MLPs are low due to historically high investment in growth projects, which results in higher depreciation expense. Payout ratios are essentially the inverse of distribution coverage, with the caveat that distributable cash flow is used for coverage and operating cash flow is used for payout ratios in this analysis. Please note that this is not an apples-to-apples comparison with distribution coverage since the payout ratios reflect the distributions paid in the period. Additionally, backdoor distribution cuts related to transactions in 2018 can create some noise in the data when comparing between 2018 and 2019. In the tables below, AMZI and AMEI constituents’ payout ratios for 4Q19 and full year 2019 are compared to their payout ratio for full year 2018, with 4Q19 coverage included for context for the AMZI.


Content continues below advertisement

This is the image alt text

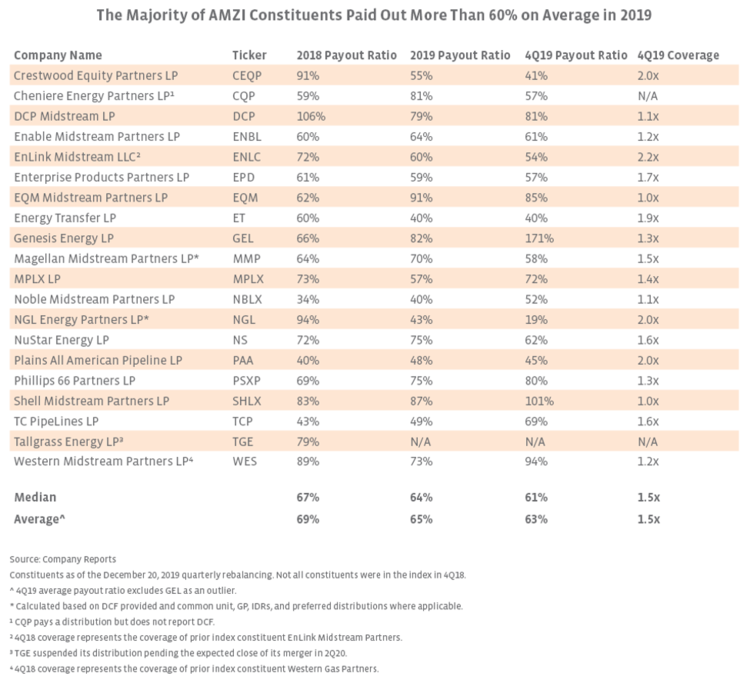
Starting with payout ratios for the AMZI, the average payout ratios in both 4Q19 and 2019 stayed relatively consistent on a year-over-year basis, with the average payout ratio declining slightly from 69% in 2018 to 65% in 2019 for the full year. The average and median payout ratios for the AMEI were a solid 62% in 2019 when excluding companies that do not pay a dividend and outliers. Overall, the high payout ratio for the AMZI reflects the ability of MLPs to pay more of their cash flow to investors because they do not pay taxes at the entity level. For context, using Bloomberg estimates, the estimated payout ratio for the S&P 500 Utilities Index (S5UTIL) was 43.0% as of the end of 2019. It’s important to provide a caveat on any direct comparisons between MLPs and other sectors given the advantaged taxation for MLPs mentioned above.

This is the image alt text

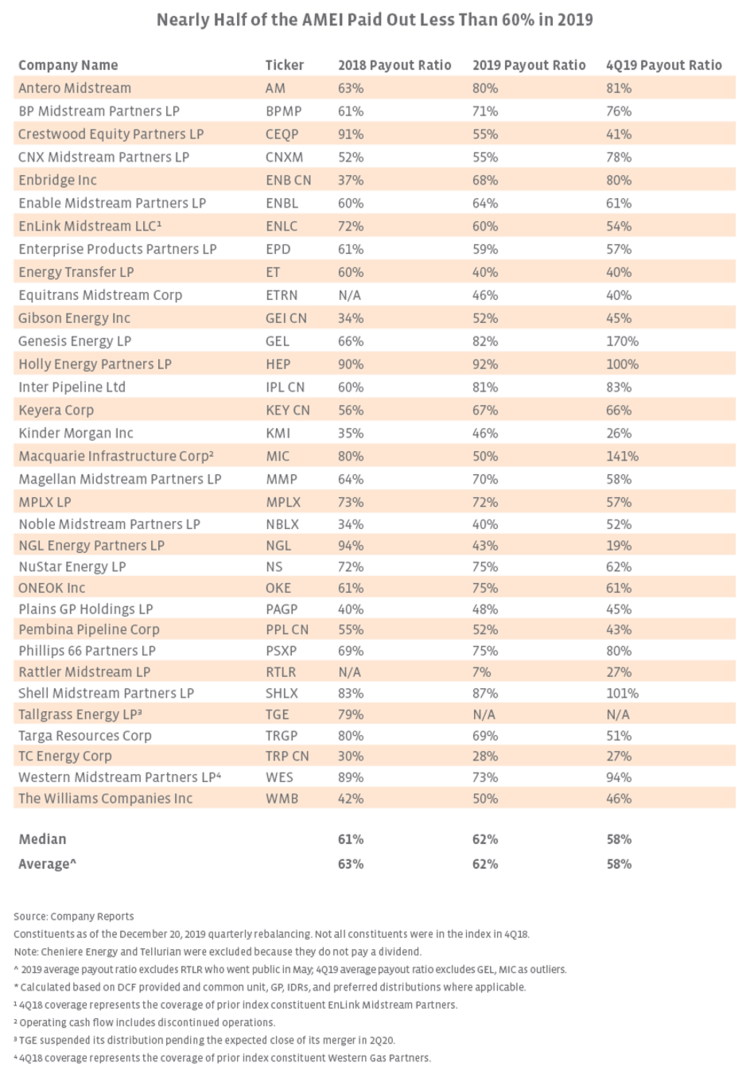
For 4Q19, the range of payout ratios among midstream companies was wide, ranging from 26% on the low end for Kinder Morgan (KMI) to 100% or more for Holly Energy Partners (HEP), Shell Midstream Partners (SHLX), and Genesis Energy (GEL), which can reflect changes in working capital or seasonality. In these cases, the full-year payout ratio is likely more informative. From a high level, the C-Corps in the AMEI averaged a payout ratio of 58% in 2019, up from 52% in 2018. Relative to the C-Corps, the MLPs in the index averaged a higher payout of 62% in 2019, which was down slightly from 71% in 2018. Nearly half of the index – 15 out of 33 companies analyzed – had a payout below 60% for full-year 2019, increasing to 17 companies for 4Q19. The average payout ratio for US C-Corps in the AMEI was nearly constant from 2018 to 2019, increasing from 57% to 58%. Payouts for the Canadian companies jumped from 45% in 2018 to 58% in 2019 as four of the six companies increased year-over-year. The different payout ratios also reflect company-specific nuances within the midstream space. KMI, for example, has a buyback program in place and is growing its dividend at 25% as it rebuilds after cutting in December 2015.

Bottom Line
While recent market volatility has pressured midstream equities, the strength in coverage ratios for MLPs and average payout ratios below 60% for midstream C-Corps should provide a degree of comfort to investors, even as yields remain high. For MLPs, higher coverage ratios underscore the ability of MLPs to afford their distributions and also reflect the improved financial positioning of these companies as a focus on distribution growth has given way to a more sustainable approach to capital allocation. Compared to years past, MLPs and midstream C-Corps are facing today’s market headwinds with improved financial flexibility, particularly among MLPs.

» Popular Pages

  • Tickers
  • Articles

Jan 27

ETF Issuer League: JPMorgan ETFs Almost $100 Billion

Jan 27

Main Management Market Note: January 27, 2023

Jan 27

As Recession Signals Grow, Turn to Risk-Managed ETFs

Jan 27

HGER Acts as a Compelling Solution for Inflation

Jan 27

Mutual Fund-to-ETF Conversions: The Future in 4 Charts

Jan 27

American Century ETF Duo Hits Key Buy Signals Friday

Jan 27

ACES and AMLP Aid Investing in the Energy Transition

Jan 27

Target Long Duration, High Quality Fixed Income

Jan 27

The Sharpe-r Way to Invest

Jan 27

Structure Matters: Volatility May Make 60/40 Unclear

QQQ

Invesco QQQ Trust

SPY

SPDR S&P 500 ETF Trust

VOO

Vanguard S&P 500 ETF

VGT

Vanguard Information...

SMH

VanEck Semiconductor ETF

XLK

Technology Select Sector SPDR...

VTI

Vanguard Total Stock Market...

SOXX

iShares Semiconductor ETF

BLOK

Amplify Transformational Data...

META

Roundhill Ball Metaverse ETF

Loading Articles...
Help & Info
  • Contact Us
Tools
  • ETF Screener
  • ETF Analyzer
  • Mutual Fund to ETF Converter
  • Head-To-Head ETF Comparison
  • ETF Country Exposure Tool
  • ETF Stock Exposure Tool
  • ETF Performance Visualizer
  • ETF Database Model Portfolios
  • ETF Database Realtime Ratings
  • ETF Database Pro
More Tools
  • ETF Launch Center
  • Financial Advisor & RIA Center
  • ETF Database RSS Feed
Explore ETFs
  • ETF News
  • ETF Picks of the Month
  • ETF Category Reports
  • Premium Articles
  • Alphabetical Listing of ETFs
  • Best ETFs
  • Browse ETFs by ETF Database Category
  • Browse ETFs by Index
  • Browse ETFs by Issuer
  • Compare ETFs
Legal
  • Terms of Use and Privacy Policy
  • © 2023 VettaFi LLC. All rights reserved.
Follow ETF Database
Follow ETF Database

Advertisement

Is Your Portfolio Positioned With Enough Global Exposure?

ETF Education Channel

How to Allocate Commodities in Portfolios

Tom LydonApr 26, 2022
2022-04-26

A long-running debate in asset allocation circles is how much of a portfolio an investor should...

Core Strategies Channel

Why ETFs Experience Limit Up/Down Protections

Karrie GordonMay 13, 2022
2022-05-13

In a digital age where information moves in milliseconds and millions of participants can transact...

}
X