ETFdb Logo
  • ETF Database
  • Content Hubs
    • Themes
      • Active ETF
      • Alternatives
      • Artificial Intelligence
      • China Insights
      • Core Strategies
      • Crypto
      • Disruptive Technology
      • Energy Infrastructure
      • ETF Building Blocks
      • ETF Investing
      • ETF Strategist
      • Financial Literacy
      • Fixed Income
      • Free Cash Flow
      • Future ETFs
      • Innovative ETFs
      • Institutional Income Strategies
      • Leveraged & Inverse
      • Market Insights
      • Market Outlooks
      • Modern Alpha
      • Nuclear Energy
      • Portfolio Strategies
      • Sector Investing
      • Tax Efficient Income
      • Thematic Investing
    • Asset Class
      • Equity
        • U.S. Equity
        • Int'l Developed
        • Emerging Market Equities
      • Alternatives
        • Gold/Silver/Critical Materials
        • Cryptocurrency
        • Currency
        • Volatility
      • Fixed Income
        • Investment Grade Corporates
        • US Treasuries & TIPS
        • High Yield Corporates
        • Int'l Fixed Income
    • ETF Ecosystem
    • ETFs in Canada
    • Market Outlook
    • Crypto ETF Hub
  • Tools
    • ETF Screener
    • ETF Country Exposure Tool
    • ETF Database Categories
    • Indexes
    • Scenario Analysis
    • Watchlists
    • Head-To-Head ETF Comparison Tool
    • Mutual Fund To ETF Converter
    • ETF Stock Exposure Tool
    • ETF Issuer Fund Flows
  • Research
    • ETF Education
    • Equity Investing
    • Dividend ETFs
    • Leveraged ETFs
    • Inverse ETFs
    • Index Education
    • Index Insights
    • Top ETF Sectors
    • Top ETF Issuers
    • Top ETF Industries
  • Webcasts
  • Sectors
    • Sector Investing Content Hub
    • XLK
    • XLI
    • XLU
    • XLY
    • XLP
    • XLRE
    • Sector Power Rankings
    • XLE
    • XLC
    • XLF
    • XLV
    • XLB
  • Multimedia
    • ETF 360 Video Series
    • ETF of the Week Podcast
    • Gaining Perspective Podcast
    • ETF Prime Podcast
    • Video
  • Company
    • About VettaFi
  • PRO
    • Pro Content
    • Pro Tools
    • Advanced
    • FAQ
    • Free sign up
    • Login
  1. Index Insights
  2. Alerian Explains It All: C Corps, MLPs, and the Midstream Indices That Contain Them
Index Insights
Share

Alerian Explains It All: C Corps, MLPs, and the Midstream Indices That Contain Them

Emily HsiehAug 13, 2018
2018-08-13

With all the reorganizations we’ve seen this year, think C Corps make up the vast majority of the midstream universe? Think again. The actual split between MLPs and corporations in the midstream universe may surprise you, with MLPs still representing comfortably more than half of the midstream market cap. In today’s post, we’ll discuss the current state of midstream companies in the context of Alerian’s suite of midstream indices — AMNA, AMUS, AMEI, AMZI. In addition, we discuss relevant ways stakeholders can use these indices for benchmarking.

What proportion of the midstream space is in a corporate versus MLP structure?
Given recent reorganization transactions, you may assume that MLPs represent less of the midstream market capitalization than in years past, with corporations becoming a more dominant piece of the pie. Instead, the proportion of midstream C Corporations versus midstream MLPs has not materially changed over the last several years. In fact, MLPs currently represent a larger percentage of the total midstream universe market capitalization versus 2014, as shown in the chart below. The 2014 numbers include Kinder Morgan’s (KMI) simplification transaction and the 2016 numbers include the Targa Resources Corp (TRGP) and SemGroup Corp (SEMG) acquisitions of their MLPs, Targa Resource Partners and Rose Rock Midstream.

This is the image alt text

Alerian’s Suite of Midstream Indices
While MLPs still make up the vast majority of the midstream market capitalization, there have been many changes this year. To continually reflect industry trends, Alerian recently launched the Alerian Midstream Energy Index (AMNA) and the Alerian US Midstream Energy Index (AMUS). In addition, the index name for AMEI was changed from the Alerian Energy Infrastructure Index to the Alerian Midstream Energy Select Index, and the AMEI methodology was revised to reflect more widely traded constituents of the AMNA.

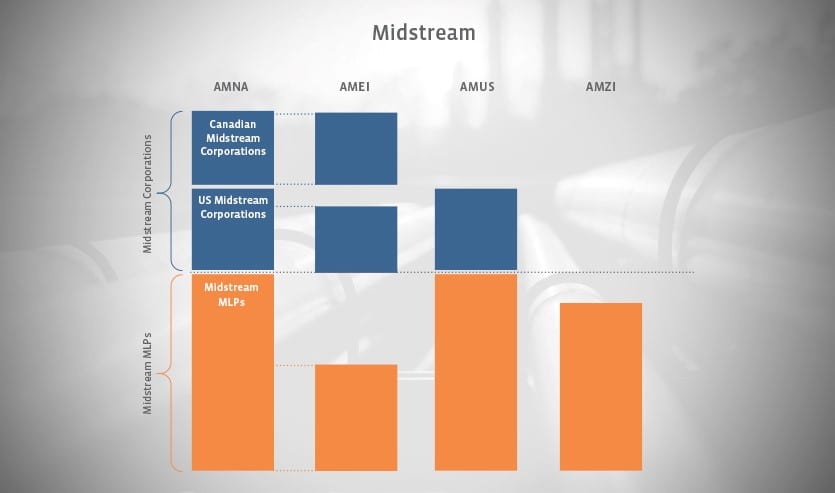
These three indices (AMNA, AMUS, AMEI), along with the Alerian MLP Infrastructure Index (AMZI), together make up Alerian’s suite of midstream energy indices. The four are related in their own ways and best explained in the chart below.


Content continues below advertisement

This is the image alt text

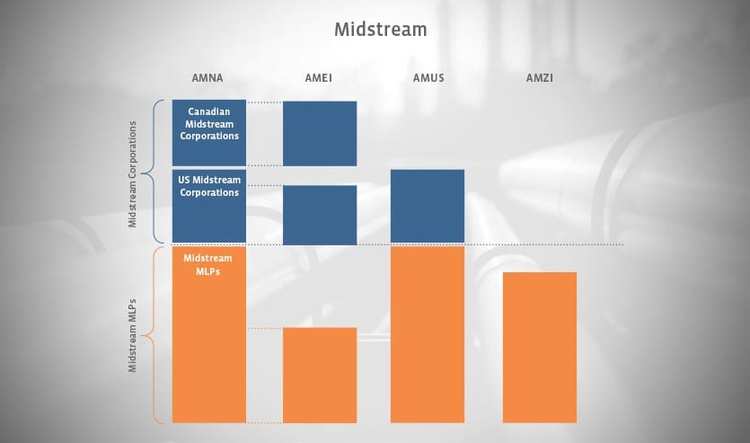
Image source: Alerian (approximate scaling)

Alerian Midstream Energy Index (AMNA) // AMNA should be viewed as the full midstream universe. It is a composite index of North American midstream energy companies. Constituents can be pass-through entities (i.e. MLPs) or corporations, have principal offices in the United States or Canada, and they must earn the majority of their cash flow from midstream activities. What’s considered a midstream activity? Per the methodology, Gathering & Processing, Liquefaction, Pipeline Transportation, Rail Terminaling, and Storage, as defined by the Energy MLP Classification Standard (EMCSSM). Constituents are capped at a 10% weighting.

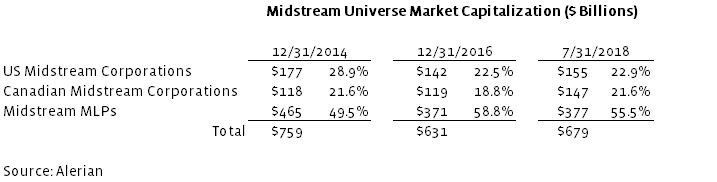
Midstream Universe Market Capitalization (in billions)

This is the image alt text

Alerian US Midstream Energy Index (AMUS) // Pretty self-explanatory, the AMUS is the US version of AMNA. No Canadian midstream companies. Constituents are capped at a 10% weighting. Sorry Canada, but there are still many other things we love about you: Tim Horton Timbits, JT dancing the Bhangra, poutine, maple syrup, nanaimo bars, Celine Dion. AMUS captures roughly 75%-80% of the midstream universe.

Alerian Midstream Energy Select Index (AMEI) // With a liquidity requirement, AMEI can be viewed as the liquid and investable subset of the AMNA. The index methodology eliminates redundant family exposure by favoring the general partner over a non-general partner. In addition, MLP exposure is limited to 25%. Similar to AMUS, AMEI also captures roughly 75%-80% of the midstream universe. (Broadly speaking, AMUS’ higher MLP weighting roughly offsets AMEI’s Canadian midstream weighting.)

Alerian MLP Infrastructure Index (AMZI) // No methodology changes were made here. The index is comprised only of midstream MLPs (no entities structured as corporations). AMZI captures roughly 50% of the midstream universe. AMZI captures roughly 85% of the midstream MLP universe.

Benchmarking – Which Alerian index to use?
While benchmarking in other asset classes may be more straightforward, for the midstream asset class, additional considerations must be made, particularly given the taxation nuances for different product types.

For products that are total return-focused and with no RIC constraints (i.e. MLPs are not limited to 25%), the AMNA or AMUS represent the cleanest midstream benchmarks. Examples of such products may be total-return focused midstream SMA (separately managed account) strategies that own both MLPs and corporations.

For products where MLPs are limited to 25%, the AMEI represents the most comparable benchmark. Examples of such products are 40 Act funds (ETFs, mutual funds, closed-end funds) that are RIC-compliant.

For products that are income-focused strategies and primarily own midstream MLPs (typically greater than 80%), the AMZI is the more relevant benchmark. Examples of such products may be income-focused SMAs and 40 Act funds (ETFs, mutual funds, closed-end funds) that are taxed as C Corporations. (Note: Depending on the percent of non-midstream MLPs owned, the AMZ may be more relevant.)

Ultimately, Alerian’s suite of four midstream indices is designed to provide more relevant benchmarking for industry stakeholders, furthering Alerian’s mission to equip investors to make informed decisions about energy infrastructure and MLPs.


» Popular Pages

  • Tickers
  • Articles

Jun 18

Dimensional Consolidates $250B Lineup Into ETF Share Classes

Jun 18

What Drives Active ETF Growth? NEOS and Thornburg Weigh In

Jun 18

Kurv Launches SpaceX Enhanced Income ETF

Jun 18

From Field to Shelf: The ETF Response to Volatile Food Prices

Jun 18

An Exciting ETF for the SpaceX Trade Lifts Off

Jun 18

ELFY: Electrification ETF Bets on Power Grid Buildout

Jun 18

Midstream Energy ETFs Prove Resilient Amid Crude Oil Drop

Jun 18

Room For Tech To Run?

Jun 18

Half a Billion in 1 Month: TSPA’s Active Take on the S&P 500 ETF

Jun 18

Space ETFs: How SpaceX Is Reshaping the Theme

QQQ

Invesco QQQ Trust Series I

VOO

Vanguard S&P 500 ETF

SMH

VanEck Semiconductor ETF

SOXX

iShares Semiconductor ETF

SCHD

Schwab US Dividend Equity ETF...

GLD

SPDR Gold Shares

PPLT

abrdn Physical Platinum...

UFO

Procure Space ETF

SPY

State Street SPDR S&P 500 ETF...

DRAM

Roundhill Memory ETF

Loading Articles...

Advertisement

Is Your Portfolio Positioned With Enough Global Exposure?

ETF Education Channel

How to Allocate Commodities in Portfolios

Tom LydonApr 26, 2022
2022-04-26

A long-running debate in asset allocation circles is how much of a portfolio an investor should...

Core Strategies Channel

Why ETFs Experience Limit Up/Down Protections

Karrie GordonMay 13, 2022
2022-05-13

In a digital age where information moves in milliseconds and millions of participants can transact...

}
X