

For this piece, we use the SPSIOP Index to represent exploration and production (E&P) companies, the OSX Index to represent oil field service (OFS) companies, the AMZ Index to represent MLPs, and the S&P 500 Energy Index as a broader energy index. We exclude refiners given that their performance has been more impacted by crude differentials than the absolute price of crude.
WTI is ~$65/bbl, but it may not feel like it for energy investors.
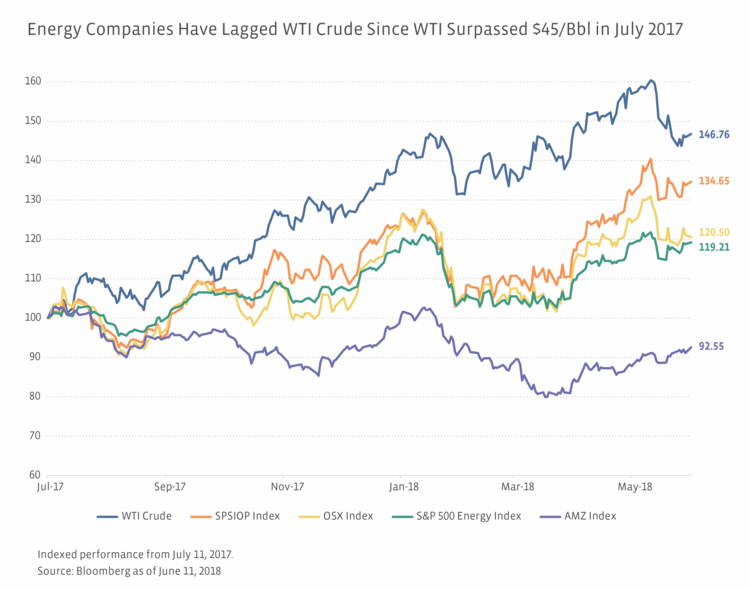
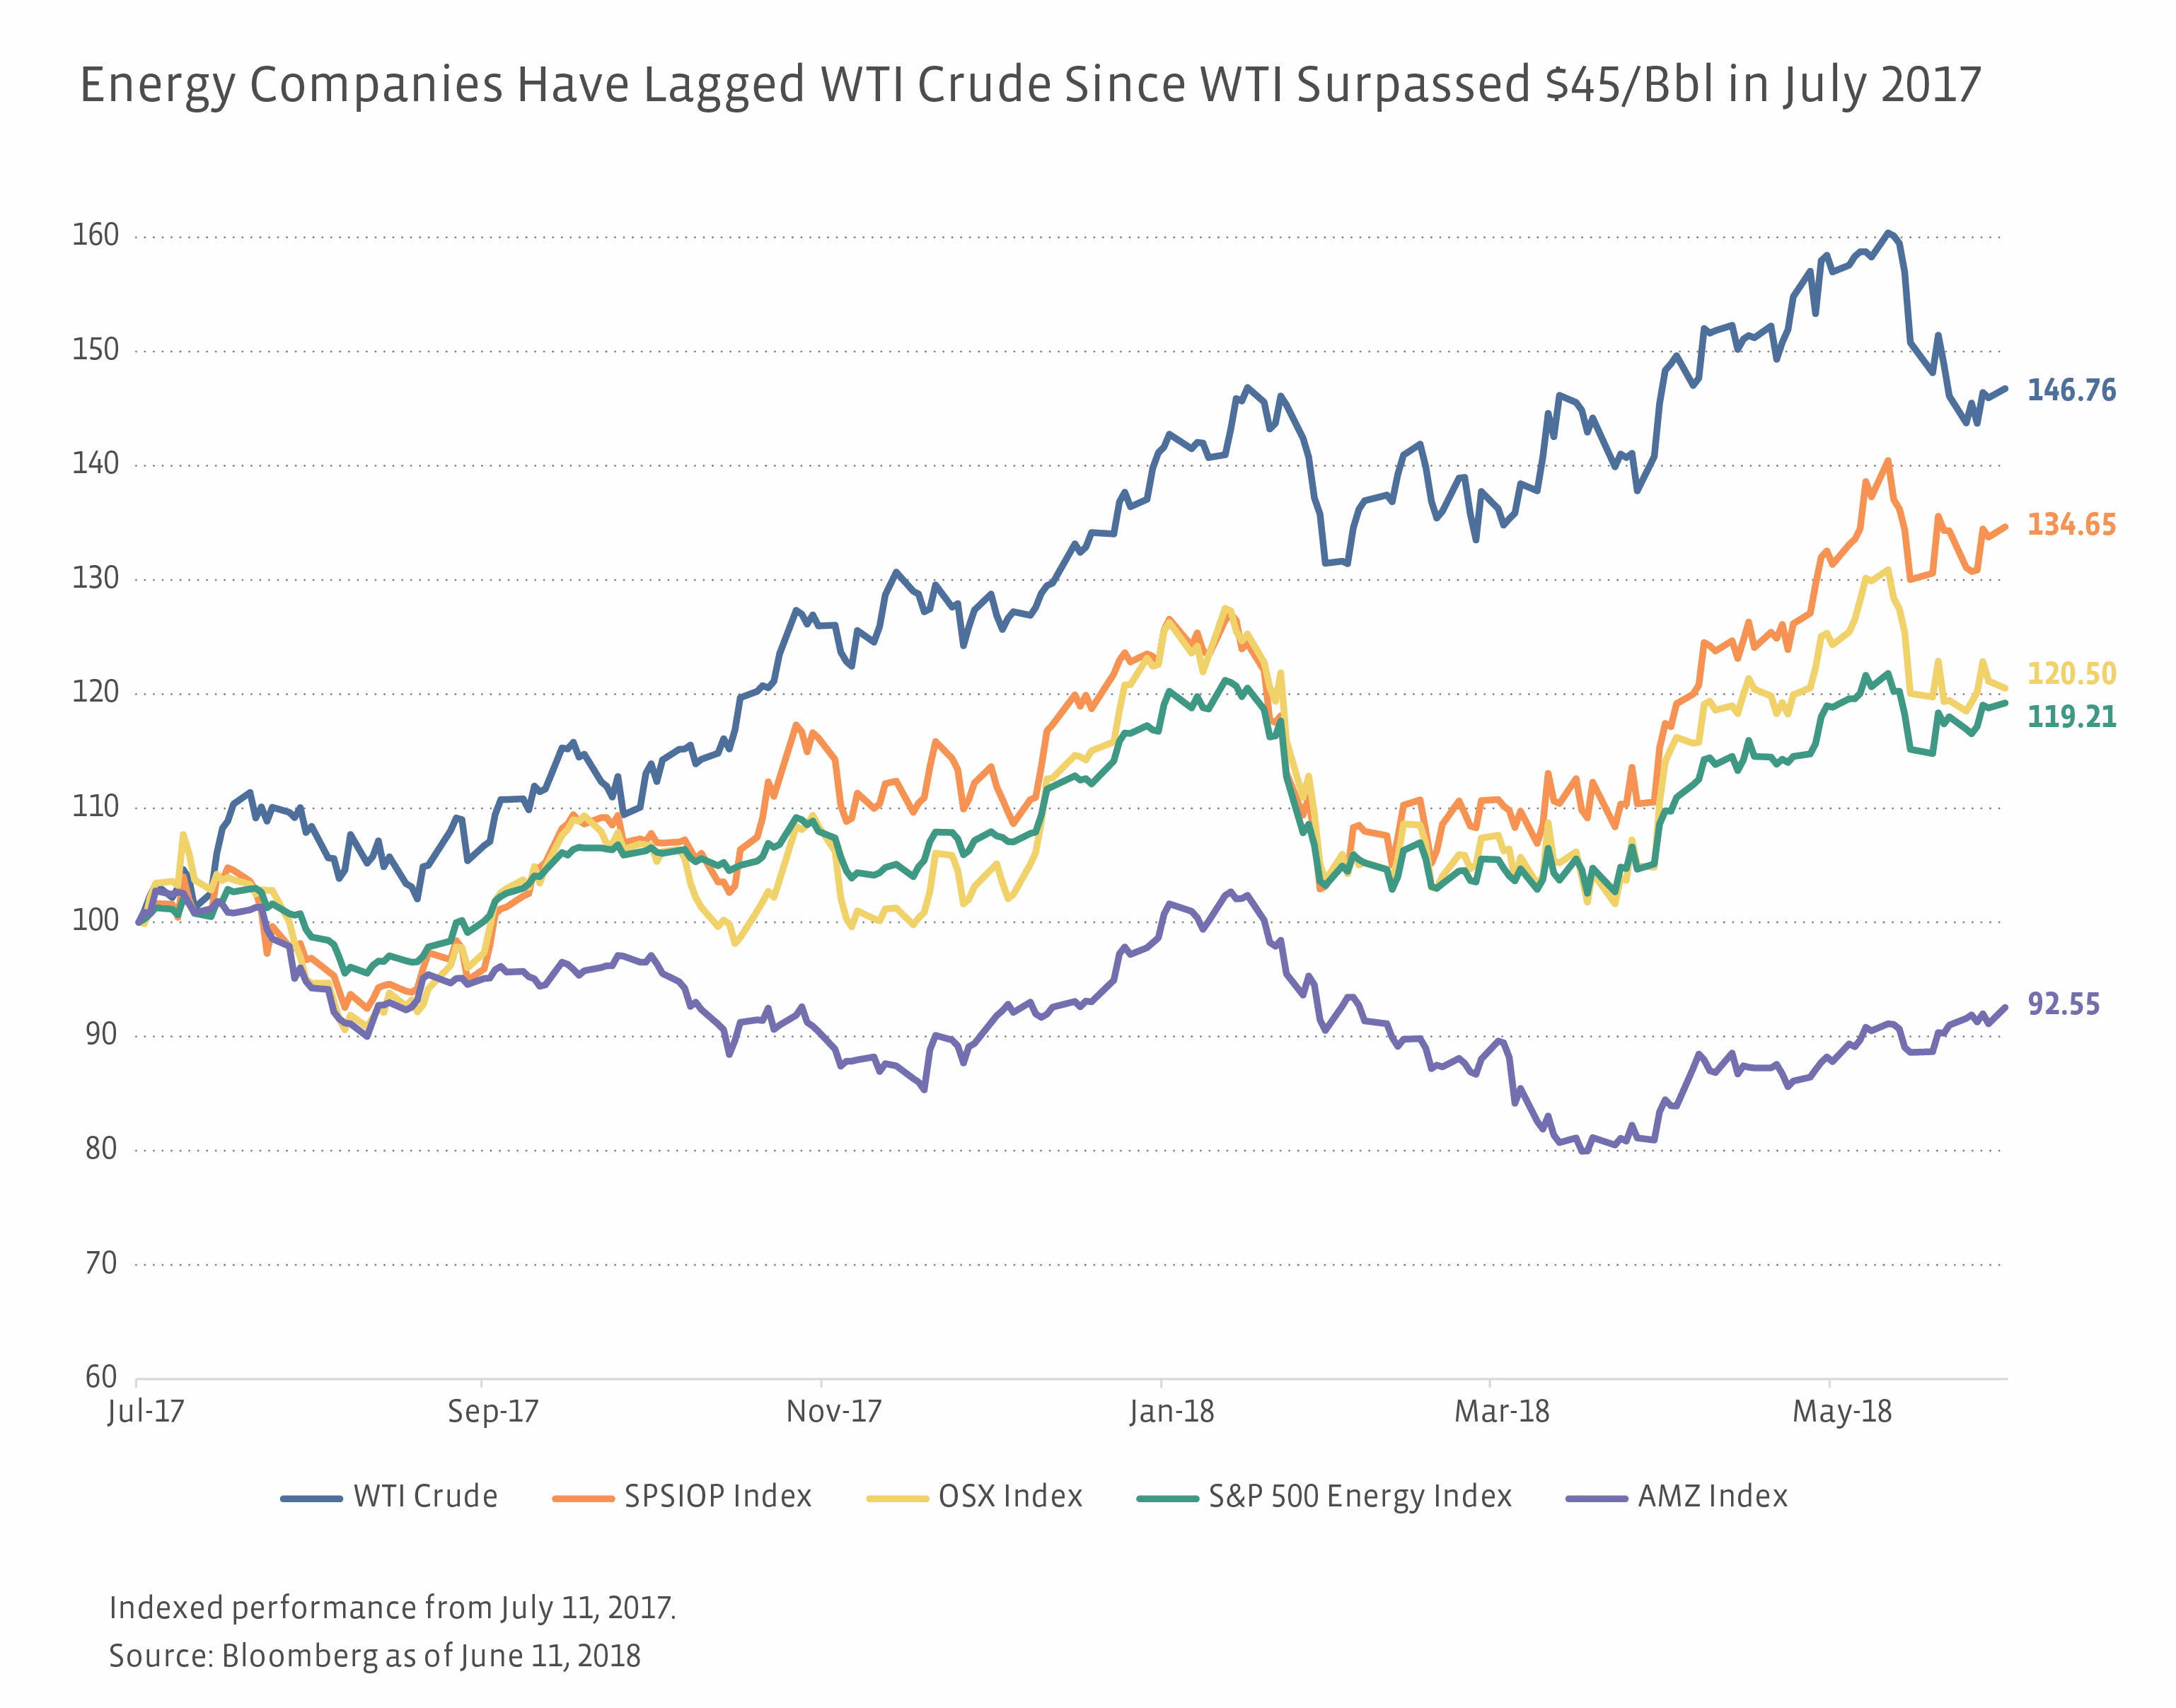
WTI crude prices have consistently traded above $45/bbl since July 11, 2017. From that date to June 11, 2018, crude prices have gained 46.8% — comfortably outpacing the gains seen in energy companies as shown in the chart of relative performance below. For reference, E&P companies are up 34.6%, oil field service companies are up 20.5% and the S&P 500 Energy Index is up 19.2% over the same time frame. MLPs, as represented by the AMZ Index, have been particularly weak relative to the improvement in crude prices, down 7.5% since July 11. We attribute this weakness to the noise in the MLP space (reorganizations, FERC news, distribution cuts), which has weighed on the space and likely kept some investors on the sidelines.
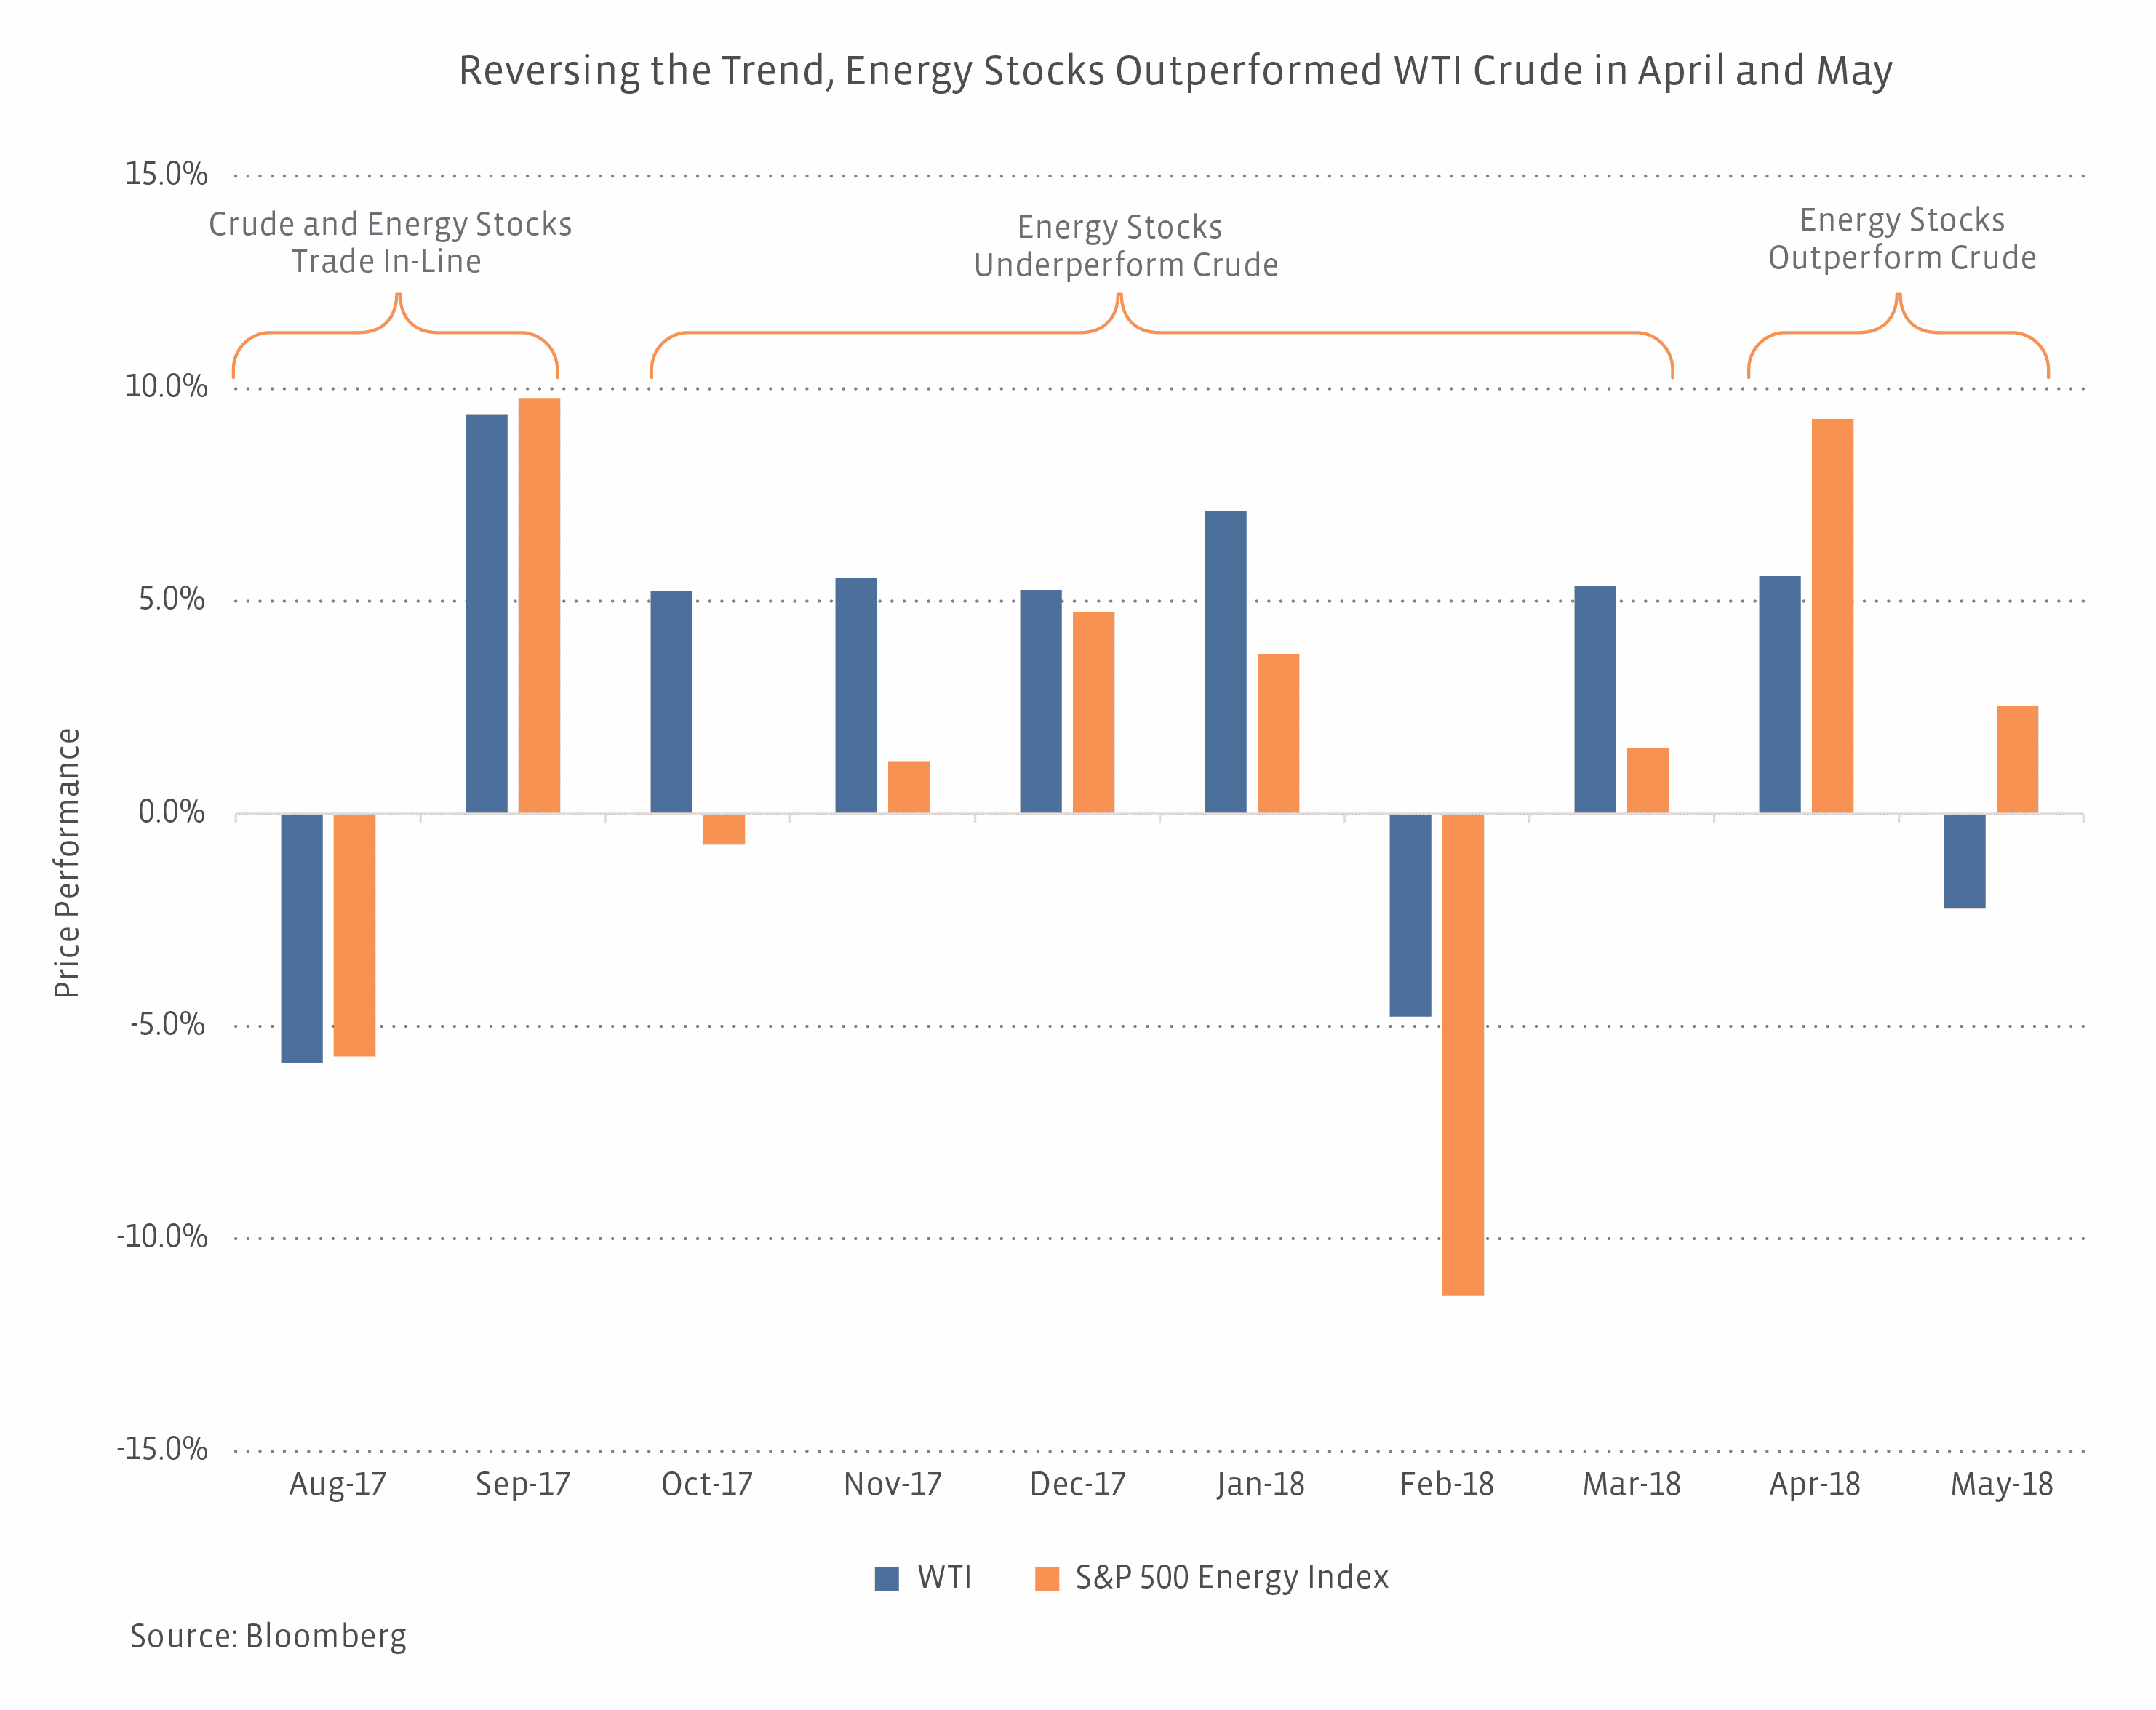
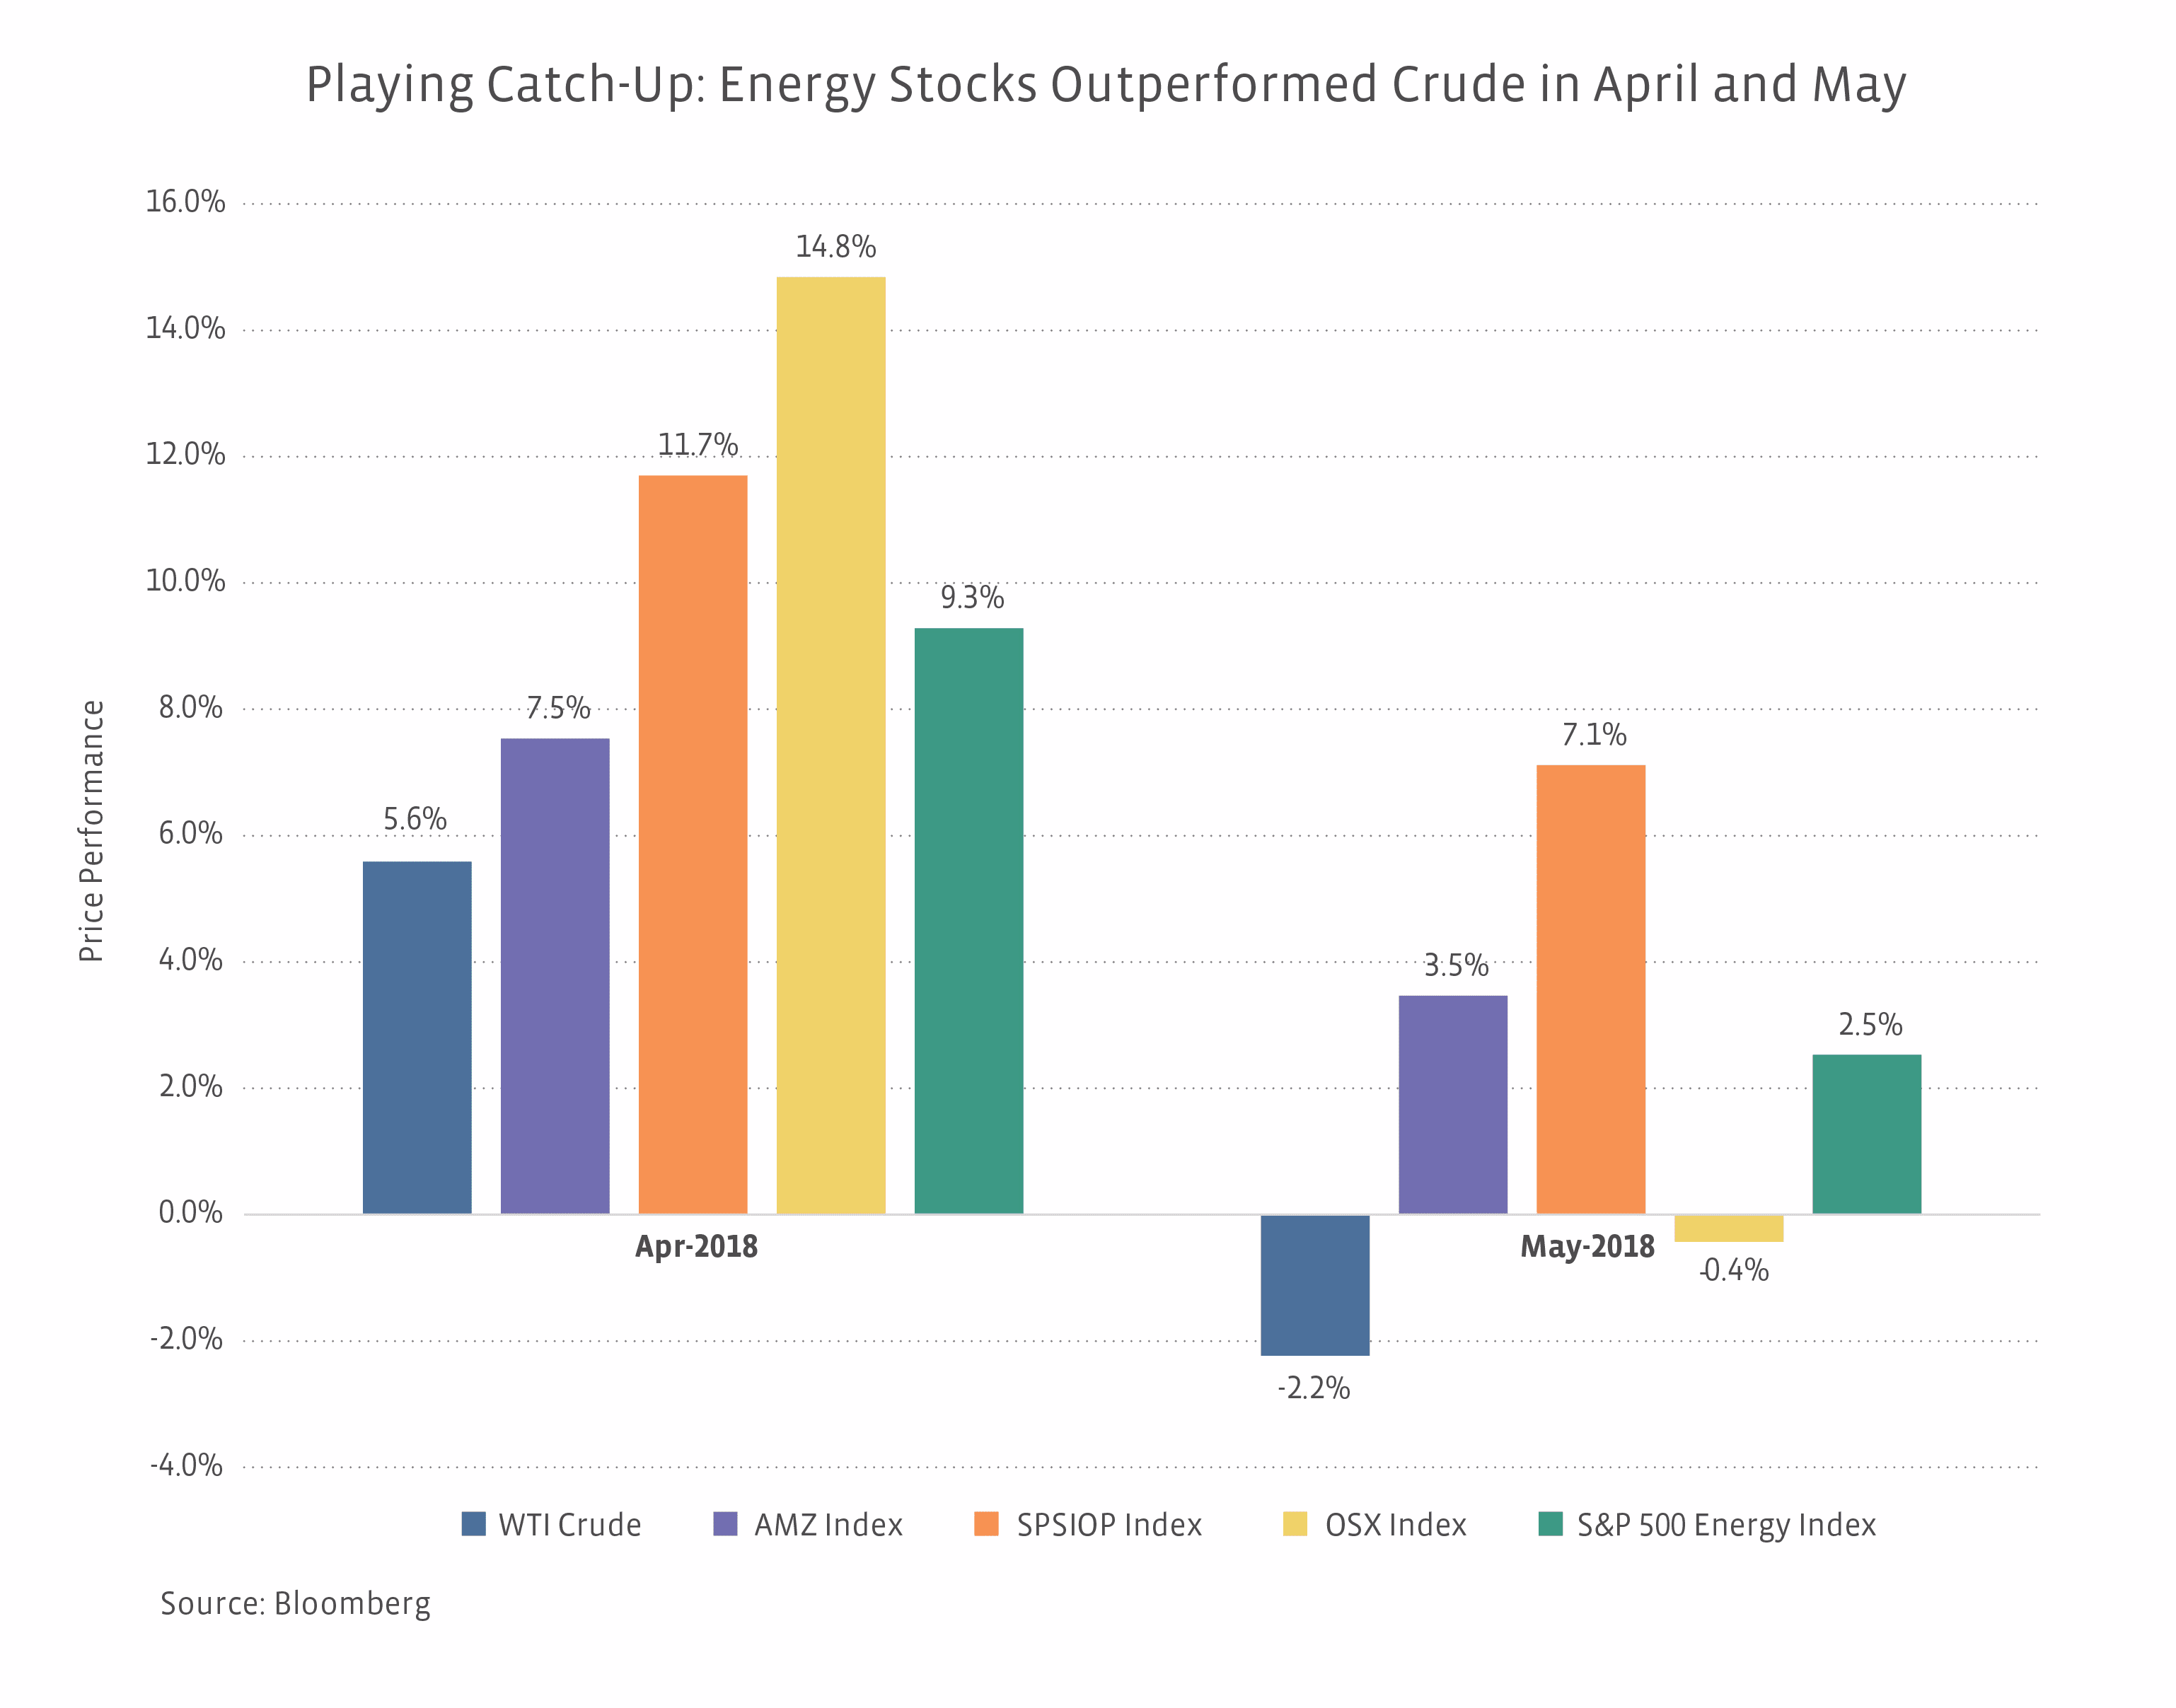
While energy stocks and MLPs are still lagging the commodity, they have played some catch-up recently. The chart below shows the price performance of crude and energy stocks in April and May, with energy stocks outperforming the commodity in both months.

Why the catch-up in April and May?
There are several viable reasons for energy stocks outperforming WTI crude in April and May. We mention just a few and admittedly paint with broad strokes. For starters, while WTI was up only 3.2% during the two-month period, Brent crude was up 10.4%. Brent is the international benchmark for crude prices. The spread between Brent and WTI has widened from ~$5/Bbl at the end of March to ~$10/Bbl currently due to infrastructure bottlenecks in the US. For some energy companies with international operations and overseas production, Brent prices may be more meaningful to their bottom line than WTI. Energy companies also tend to report earnings from mid-April to mid-May, which could have implications for company stock performance aside from the oil price.
For MLPs, widening crude spreads may have been more impactful than the absolute crude price change in April and May. The widening discounts for Permian crude and widened spreads between WTI Cushing and the Gulf Coast (Houston crude prices are currently ~$7/Bbl above prices at Cushing) can create opportunities for MLPs with existing pipeline capacity from areas with price discounts. These pricing discounts also point to the need for more infrastructure investment.
The outperformance by energy stocks, particularly for May, could also be more reflective of the relative weakness in WTI crude. WTI prices were rising for most of the month of May, closing above $72/Bbl on May 22nd, but WTI fell sharply to finish the month at $67/Bbl. To look at it from another angle, oil may have been pressured by profit taking, with financial players cutting their net long position in both Brent and WTI by 302 million barrels over the seven weeks ended June 5, 2018. In other words, oil speculators may have been selling or closing positions, but that wouldn’t necessarily translate to investors selling energy stocks.
Perhaps, we saw some sector rotation into energy. At the MLP and Energy Infrastructure Conference last month, there was some discussion of the energy sector being relatively unloved, in contrast to investors’ high esteem for the technology sector. A comparison was drawn between 2018 and 1999, when energy fundamentals were strong, but investors wanted to own tech stocks. With the S&P Information Technology Index falling 4.0% from the end of January to the end of April, perhaps some generalists moved into energy. (To be fair, technology recovered by gaining 7.1% in May.) Energy’s weighting in the S&P 500 remains low at 6.26% as of May 31st, though it’s an improvement from year-end 2017 (6.07%) and from the end of February (5.51%).
Bottom line: Two months doesn’t make a trend, but the catch-up is nice to see.
Two months of energy stocks outperforming WTI crude doesn’t make a trend, but it is nice to see energy stocks’ price performance closing the gap with the improvement in crude prices. If the trend is to continue, more investor dollars will need to flow into energy stocks. Continued oil stability (or rising prices) would likely be constructive for getting investors comfortable with putting more money into energy stocks. In the near-term, oil prices may see increased volatility associated with geopolitical issues and the OPEC meeting scheduled for June 22nd.
Alerian is on Twitter! Join the conversation with @AlerianIndices.

