ETFdb Logo
  • ETF Database
  • Content Hubs
    • Themes
      • Active ETF
      • Alternatives
      • Artificial Intelligence
      • China Insights
      • Core Strategies
      • Crypto
      • Disruptive Technology
      • Energy Infrastructure
      • ETF Building Blocks
      • ETF Investing
      • ETF Strategist
      • Financial Literacy
      • Fixed Income
      • Free Cash Flow
      • Future ETFs
      • Innovative ETFs
      • Institutional Income Strategies
      • Leveraged & Inverse
      • Market Insights
      • Market Outlooks
      • Modern Alpha
      • Nuclear Energy
      • Portfolio Strategies
      • Sector Investing
      • Tax Efficient Income
      • Thematic Investing
    • Asset Class
      • Equity
        • U.S. Equity
        • Int'l Developed
        • Emerging Market Equities
      • Alternatives
        • Gold/Silver/Critical Materials
        • Cryptocurrency
        • Currency
        • Volatility
      • Fixed Income
        • Investment Grade Corporates
        • US Treasuries & TIPS
        • High Yield Corporates
        • Int'l Fixed Income
    • ETF Ecosystem
    • ETFs in Canada
    • Market Outlook
    • Crypto ETF Hub
  • Tools
    • ETF Screener
    • ETF Country Exposure Tool
    • ETF Database Categories
    • Indexes
    • Scenario Analysis
    • Watchlists
    • Head-To-Head ETF Comparison Tool
    • Mutual Fund To ETF Converter
    • ETF Stock Exposure Tool
    • ETF Issuer Fund Flows
  • Research
    • ETF Education
    • Equity Investing
    • Dividend ETFs
    • Leveraged ETFs
    • Inverse ETFs
    • Index Education
    • Index Insights
    • Top ETF Sectors
    • Top ETF Issuers
    • Top ETF Industries
  • Webcasts
  • Sectors
    • Sector Investing Content Hub
    • XLK
    • XLI
    • XLU
    • XLY
    • XLP
    • XLRE
    • Sector Power Rankings
    • XLE
    • XLC
    • XLF
    • XLV
    • XLB
  • Multimedia
    • ETF 360 Video Series
    • ETF of the Week Podcast
    • Gaining Perspective Podcast
    • ETF Prime Podcast
    • Video
  • Company
    • About VettaFi
  • PRO
    • Pro Content
    • Pro Tools
    • Advanced
    • FAQ
    • Free sign up
    • Login
  1. Index Insights
  2. By the Numbers: The Alerian Exit Effect
Index Insights
Share

By the Numbers: The Alerian Exit Effect

Emily HsiehOct 21, 2014
2014-10-21

In part 1 of our “By the Numbers: The Alerian Effect” series, we highlighted how names entering the Alerian MLP Index (AMZ) and Alerian MLP Infrastructure Index (AMZI) outperform the respective index on the date of the rebalancing announcement by an average of 316 bps. We also discussed how the outperformance is magnified for names joining the AMZI versus the AMZ due to higher weightings and more AUM tracking the AMZI relative to the AMZ. Today, we’ll analyze the same announcement date impacts for names exiting the index.

Before beginning, we want to make clear that a removal from (or addition to) an Alerian index does not represent an opinion by Alerian on the company’s operations, growth projections, or management. It’s purely a methodological determination and generally comes down to three factors: market capitalization, adjusted market capitalization, and trading liquidity.

Now, onto the study.

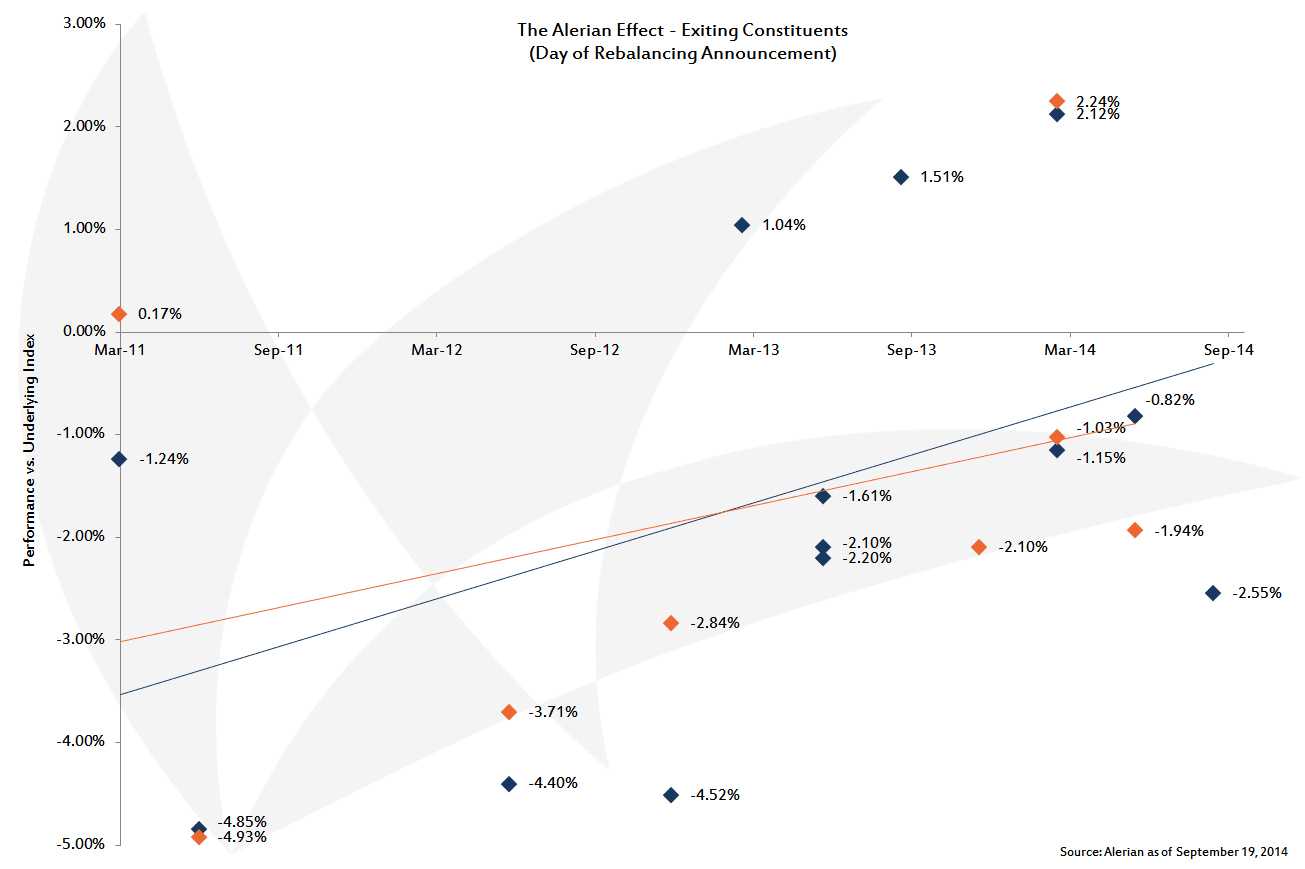
I hate to be the bearer of bad news, but since March 2011, the names that have been removed from the AMZ or AMZI have underperformed their respective index by 166 bps on the day of announcement, on average. On the bright side, this represents a more muted impact—nearly half—versus the names entering the index, which as we noted above is +316 bps. In addition, out of the 21 quarterly rebalancings with constituent changes, five MLPs actually outperformed the underlying index on announcement date.

As for whether the impact is more magnified for the AMZ (blue diamonds) or AMZI (orange diamonds), the difference is marginal. On average, names leaving the AMZ underperform the index by 160 bps on the announcement date versus 177 bps for names leaving the AMZI.  Based on the upward trending lines, it would seem that the “Alerian Exit Effect” is becoming more muted over time. Visually that may be the case, but the data isn’t conclusive (yet). The R-squared values for the AMZ and AMZI trendlines are 0.20 and 0.14, respectively, suggesting little statistical significance.

2014.10.19 By the Numbers - Alerian Effect

For what it’s worth, one possible explanation for why the exit effect isn’t getting worse (at least visually), despite the fact that AUM linked to the AMZ and AMZI continues to grow, is efficient markets .   It’s just a hypothesis, so don’t take it as an absolute.

The removal from (or addition to) a passive index does not affect the underlying business of a company. So if markets are truly efficient, meaning equities trade on fundamentals of all available information and not on sentiment, then savvy investors may see non-fundamental-based market reactions (such as the interpretation of index removal as a negative sign) as opportunities to buy. The more rebalancing iterations there are, the more investors start catching on and the less exaggerated corrections may be. Keep in mind, the key word in the phrase “if markets are efficient” is “if”.

Some could argue that one day may not be enough time for the markets to correct. In the next “By the Numbers: The Alerian Effect” series, we’ll delve into the performance of names entering and exiting the index during the period from the rebalancing announcement date to the actual rebalancing date to test this efficient markets theory further.


Content continues below advertisement

» Popular Pages

  • Tickers
  • Articles

Jun 23

Active Tech ETF GTEK Delivers Smashing YTD Performance

Jun 23

Biotech ETFs Gain Momentum via AI Drug Discovery & Surging M&A

Jun 23

Bitcoin Miners Are Winning the AI Boom

Jun 23

Which Route During a Tech Rout? Two Low Volatility ETFs

Jun 23

Active ETFs Hit Record $2.49T in Assets Through May

Jun 23

Capture Midcap Momentum With XMMO's Surprising Sector Tilts

Jun 23

SpaceX Takes Center Stage in HALX June Rebalance

Jun 23

High Yield Continues to Drift Toward Higher Quality

Jun 23

National Bank Launches New NBI Thematic Rotation ETF

Jun 23

REIT ETFs: Real Estate's Quiet Revival

QQQ

Invesco QQQ Trust Series I

VOO

Vanguard S&P 500 ETF

GLD

SPDR Gold Shares

SMH

VanEck Semiconductor ETF

DRAM

Roundhill Memory ETF

SOXX

iShares Semiconductor ETF

PPLT

abrdn Physical Platinum...

SIVR

abrdn Physical Silver Shares...

SCHD

Schwab US Dividend Equity ETF...

SOXL

Direxion Daily Semiconductor...

Loading Articles...

Advertisement

Is Your Portfolio Positioned With Enough Global Exposure?

ETF Education Channel

How to Allocate Commodities in Portfolios

Tom LydonApr 26, 2022
2022-04-26

A long-running debate in asset allocation circles is how much of a portfolio an investor should...

Core Strategies Channel

Why ETFs Experience Limit Up/Down Protections

Karrie GordonMay 13, 2022
2022-05-13

In a digital age where information moves in milliseconds and millions of participants can transact...

}
X