
While midstream and listed infrastructure have underperformed broader markets this year, both sectors are typically considered more defensive during periods of market volatility given the high percentage of regulated or fee-based cash flows. In general, demand for both kinds of assets have a degree of inelasticity given their essential and long-lived nature. Infrastructure represents a potentially significant area of growth as both developed and developing economies require considerable investments in infrastructure over the next fifteen years to facilitate economic advancement. A recent study suggested nearly $70 trillion would be necessary to fund global infrastructure needs through 2035 as real GDP expands. This growth aligns with the long-term thesis for energy infrastructure, which will continue to be required to meet rising demand for energy domestically and abroad.
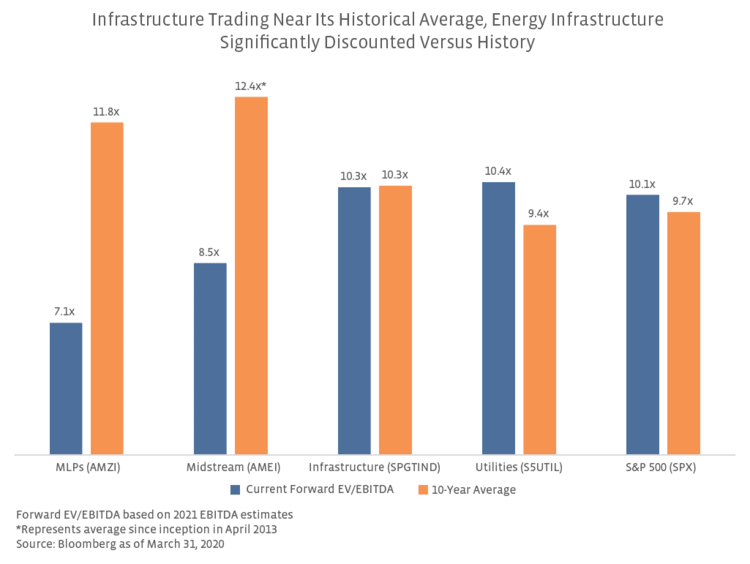
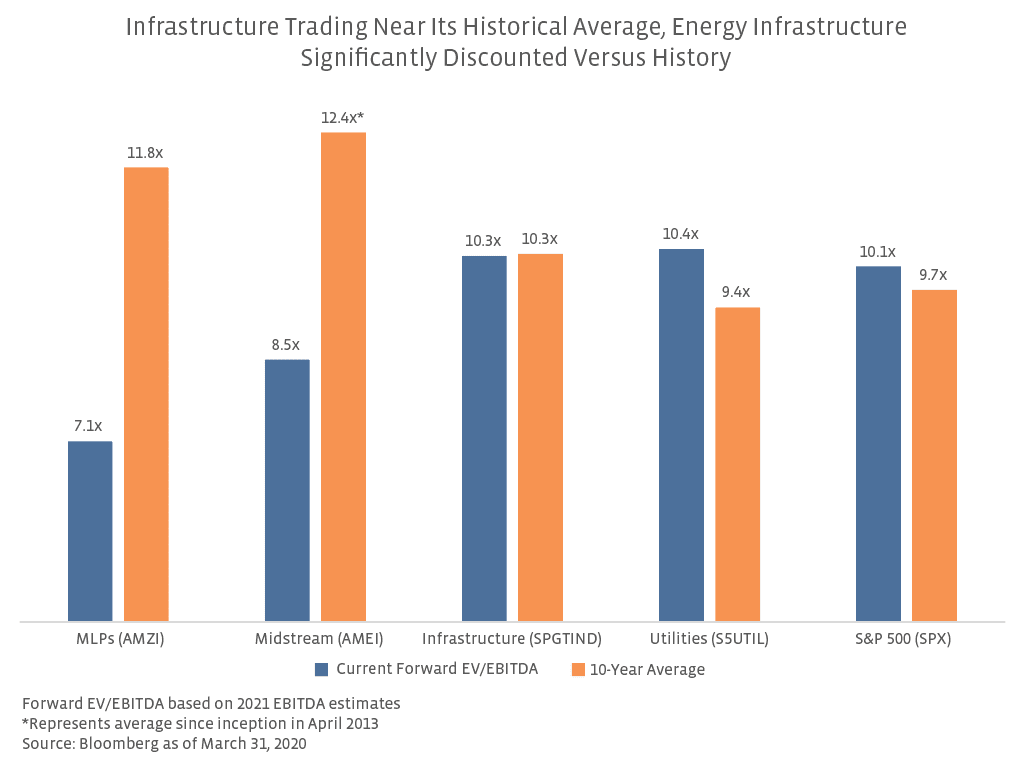
In the context of the recent downturn, it is useful to consider the valuation of infrastructure versus midstream. As of the end of March, infrastructure was trading nearly in line with its ten-year average forward EV/EBITDA multiple compared to significant discounts for MLPs and midstream (see chart below). Similarly, the S&P 500 and Utilities were trading at a premium relative to history. Given recent performance for energy infrastructure, valuation metrics are heavily discounted compared to historical averages.
Infrastructure investment characteristics are likely familiar to midstream investors.
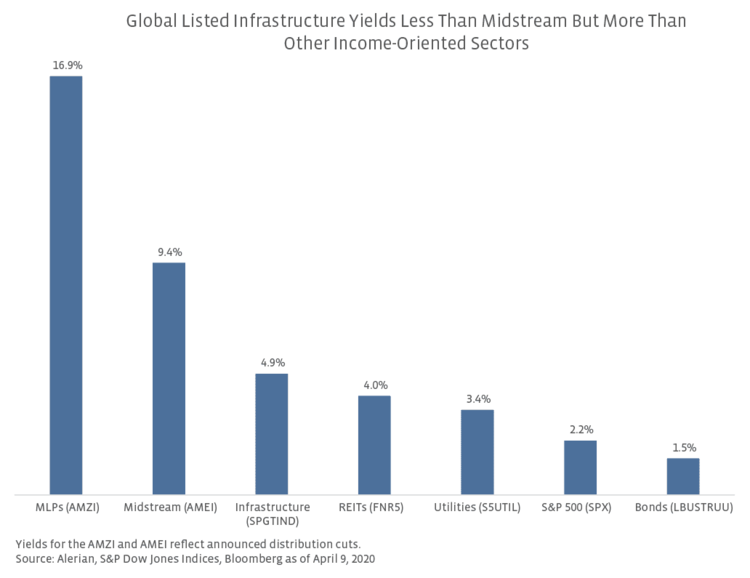
Similar to the midstream space, listed infrastructure provides substantial income as a result of the stable cash flows generated by underlying assets and services. Some infrastructure assets benefit from inflation escalators in contracts and regulated rates, such as cost of service rates for utilities or FERC-regulated tariffs for interstate pipelines. Toll roads can generate relatively stable cash flows through collection of revenue from drivers, while airports earn revenue from core aeronautical activities and other items like concessions and parking. The chart below compares the yields for listed infrastructure against other income-oriented asset classes as of April 9. Infrastructure yielded 4.9%, exceeding the other asset classes except MLPs and midstream.
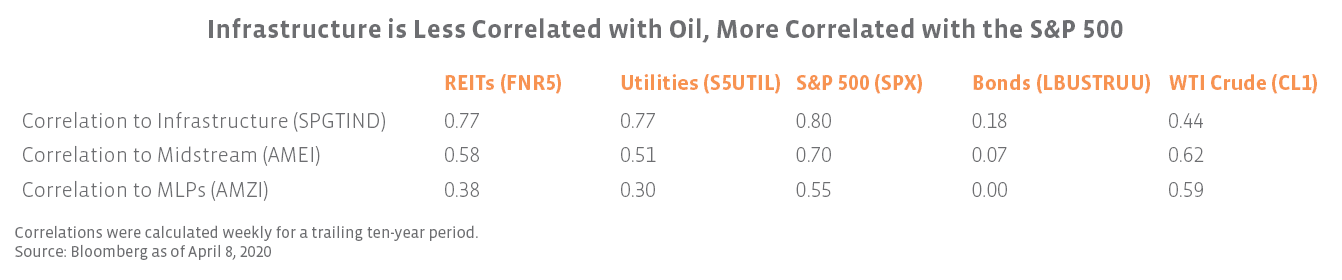
In portfolios, energy infrastructure not only offers generous income, but it can provide a diversification benefit as well given moderate correlations with other income-oriented assets such as REITs and utilities (read more). Notably, as shown in the table below, infrastructure has a higher correlation with many of these same asset classes. As mentioned previously, broad listed infrastructure indexes often encompass multiple sectors, including midstream and utilities. Infrastructure is considered more defensive than the broader market but still retains a relatively high long-term correlation to the S&P 500 at 0.80. Investors should balance how they use energy infrastructure and global infrastructure in their portfolios, considering their benefits while also ensuring existing allocations to sectors like utilities do not overlap. While midstream and MLPs have a lower correlation with the broader market than infrastructure, they have a higher correlation with crude prices, which has led to increased volatility. The ten-year standard deviation for infrastructure was 14.4% as of March 31 compared to 14.2% for the S&P Global Broad Market Index (SBBMGLU). The standard deviation for the AMEI and AMZI were both significantly higher than infrastructure at 21.4% for the AMEI and 23.7% for the AMZI.
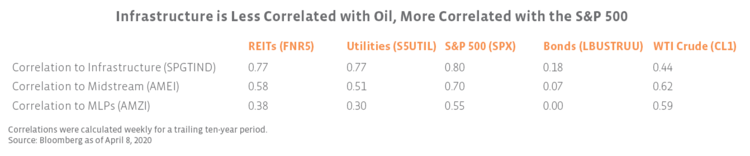
Given the overlap between infrastructure and energy infrastructure, one would expect a significant correlation between infrastructure and MLPs and midstream. The ten-year correlation between infrastructure and MLPs was 0.58, while the ten-year correlation with midstream was higher at 0.78.
Bottom Line
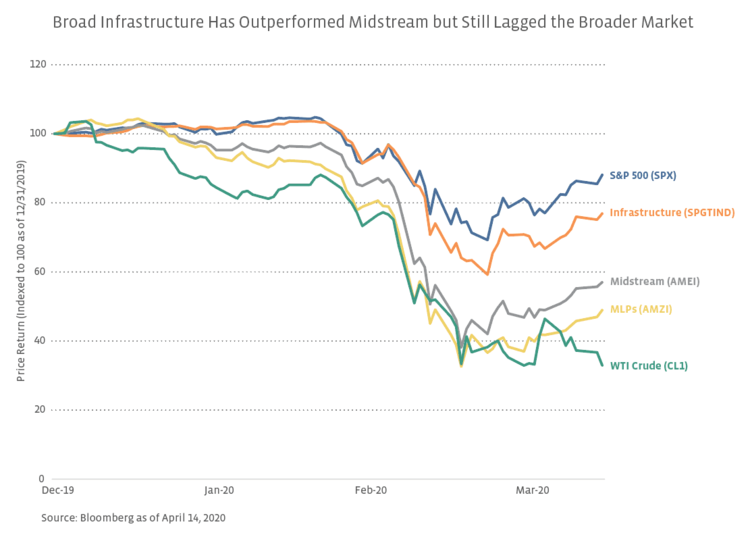
While listed infrastructure and midstream are similar in their exposure to real assets and provision of attractive income to investors from steady cash flows, the diversity of sectors within global infrastructure has helped it outperform the energy infrastructure subset this year, although both have underperformed the S&P 500. Infrastructure has more leverage to the broader economy, while energy infrastructure has been disproportionately pressured by the severe sell-off in oil prices. In comparing broader infrastructure with energy infrastructure as investment options, midstream’s more generous income, lower equity market correlation, and discounted valuations have to be balanced against infrastructure’s lower volatility and fuller valuation.

