
Summary
- Passive exchange-traded products seek to replicate the performance of their underlying indexes, are publicly traded and transparent about holdings, and generally have lower fees and less turnover. In contrast, actively managed funds seek to outperform their benchmark index through skilled research.
- Active funds show similarity to their benchmark indexes given some overlap in constituents due to a limited investment universe as well as relatively high correlations and other tracking metrics.
- While the aim of active investing to consistently outperform a market benchmark on a risk-adjusted basis is enticing, many midstream funds fail to consistently generate superior returns after fees over the long term.
Midstream investing has come a long way since the first MLP closed-end fund was introduced in 2004, and there are now a variety of ways to access the midstream space. One age-old question in investing is whether an active or passive strategy is better. Proponents of active investing claim outperformance of a benchmark can be achieved with skillful selection, while advocates of passive investing argue that excess returns cannot be maintained over the long run and prefer a hands-off approach with lower fees. Today’s note examines the numerous factors relevant to this debate for midstream, including the characteristics of the products, applicable risk-return metrics, and the potential for closet indexing.
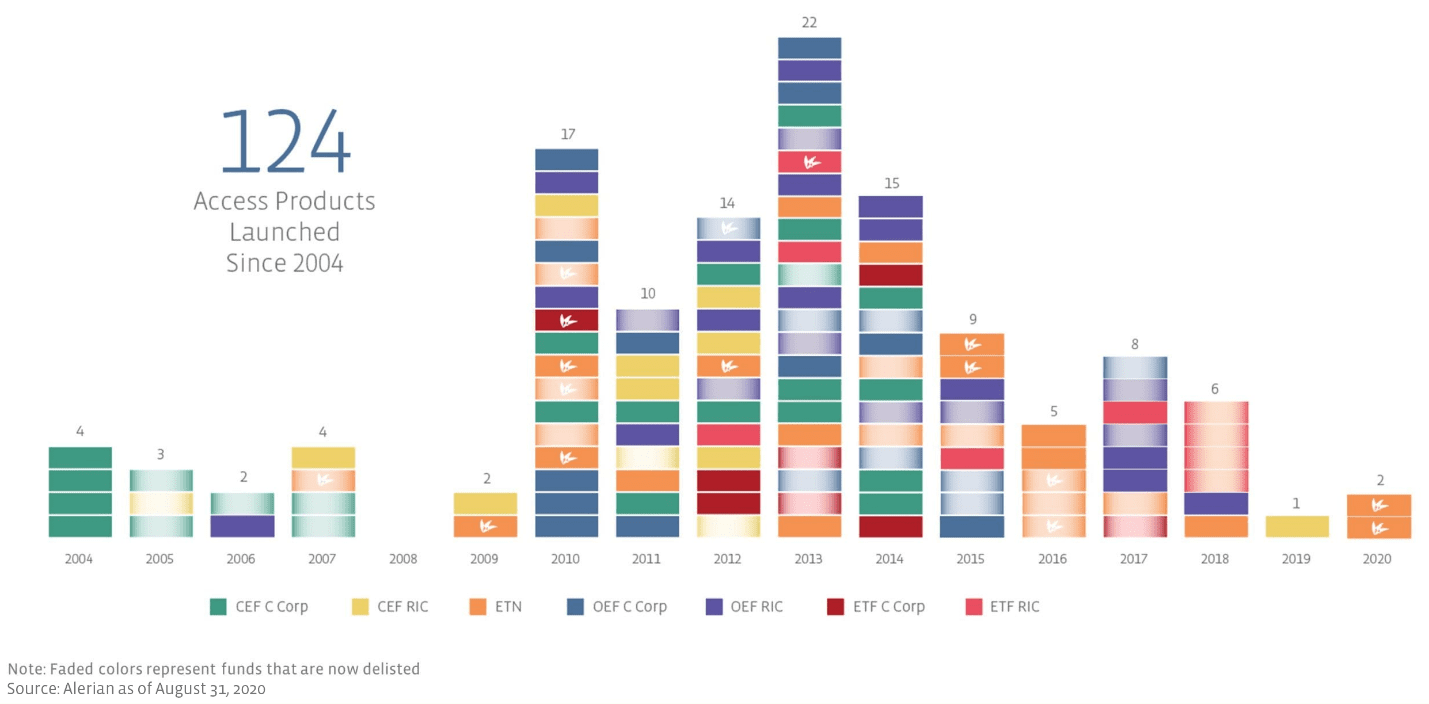
The universe of midstream investment products is large and continues to evolve. The first MLP closed-end fund came to market in 2004 and was the first product to provide investors a way to invest in MLPs without having to file K-1 forms. Over the last sixteen years, 124 midstream products have been launched in total, with 76 of those still active as of August 31. These midstream access products span different investment product structures and strategies. Midstream exchange-traded products, including exchange-traded funds (ETFs) and exchange-traded notes (ETNs), almost universally leverage a passive strategy – there are only two actively managed midstream ETFs currently. Passive exchange-traded products seek to replicate the performance of their underlying indexes, are publicly traded and transparent about holdings, and generally have lower fees and less turnover. In contrast, actively managed funds seek to outperform their benchmark index through skilled research, capitalizing on opportunities but also trying to minimize downside risk during challenging market environments. Active funds may also utilize leverage and turn over their portfolios more often given their objective of outperforming. In addition to strategy, midstream funds are also nuanced in how they are taxed. Funds that invest more than 25% of their portfolio in MLPs are taxed as C-Corps, while funds with less than 25% invested in MLPs are structured as Regulated Investment Companies (RICs), which function as pass-throughs. For an introduction on midstream investing, please refer to our primer on Energy Infrastructure Investing or this recent research note.

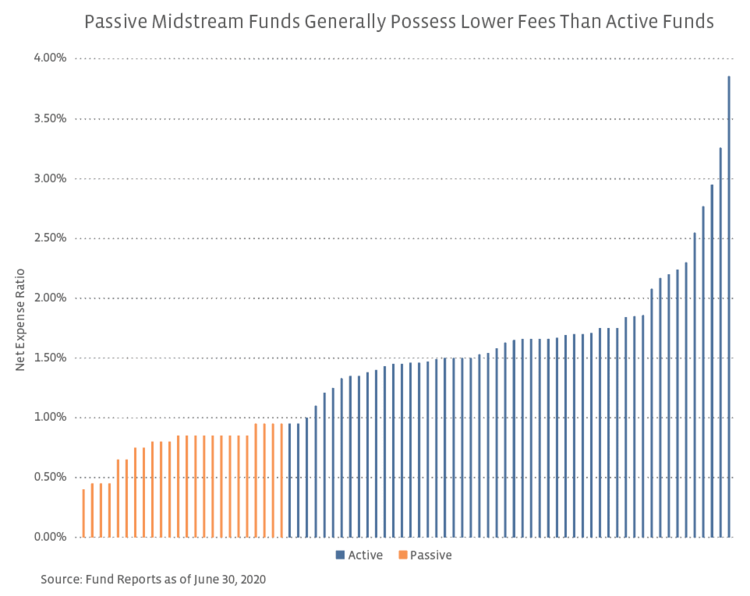
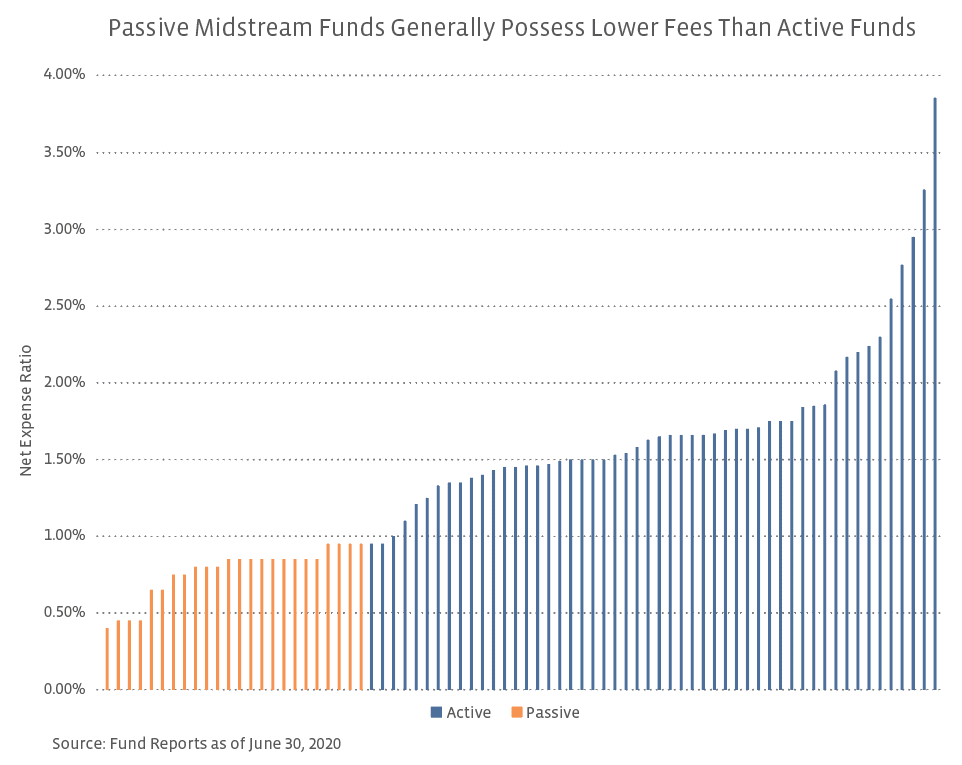
Passive midstream funds have lower fees than active funds. Fees for midstream access products vary widely as a result of management fees for active funds, expenses related to handling taxation (managing K-1s), and other administrative duties on behalf of investors, which can be significant for 100% MLP funds. The chart below compares the net expense ratio without borrowing or tax expenses for active midstream funds to the expense ratio for passive exchange-traded products with assets under management greater than $100 million. On average, passive products had an expense ratio of 0.77% compared to a net expense ratio of 1.72% for active funds. The wide gap in fees is meaningful for performance over the long term as actively managed funds have to consistently outpace their benchmark to justify the higher fees.
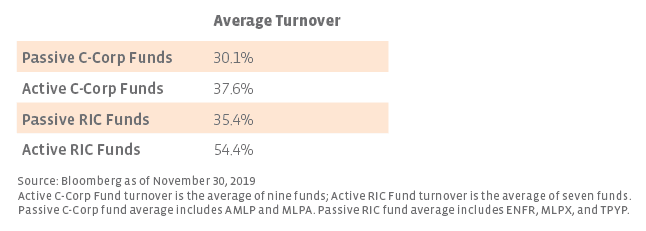
Active funds tend to have higher turnover than passive funds. Turnover ratio, a metric used to reflect how much a portfolio’s holdings have changed in a given year, is another point of difference between active and passive funds. In general, passive funds have lower turnover because they track an index and may follow a rules-based methodology designed to limit the churn within the index. Active funds, in contrast, do not have limitations on turnover, and changes in holdings may occur more frequently as managers seek to produce excess returns and exploit changes in the market. High turnover can also result in increased costs related to trading and taxation and therefore higher expenses. The table below highlights average fund turnover for the nine of the largest active C-Corp funds and seven RIC funds per Bloomberg for the last reported fund year as of November 30, 2019, compared to passive C-Corp and RIC products. For comparability, funds were excluded that did not share the same fiscal period. Fund turnover for the passive C-Corp and RIC funds was the lowest at 30.1% and 35.4%, respectively, indicating that the passive fund holdings changed by less than the active funds over the one-year period.
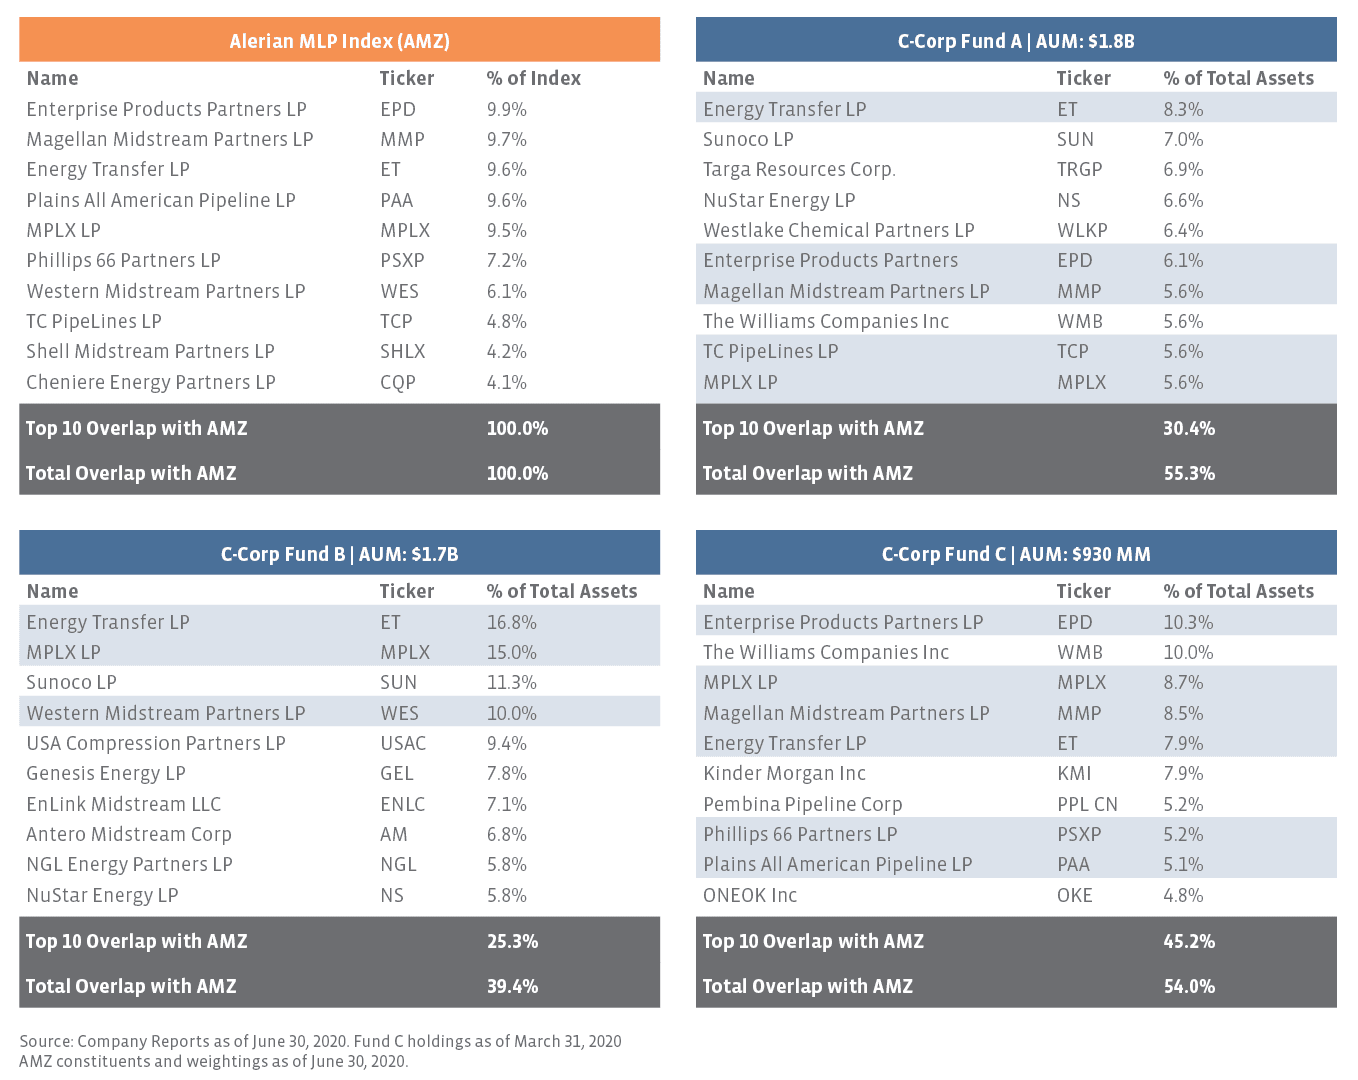
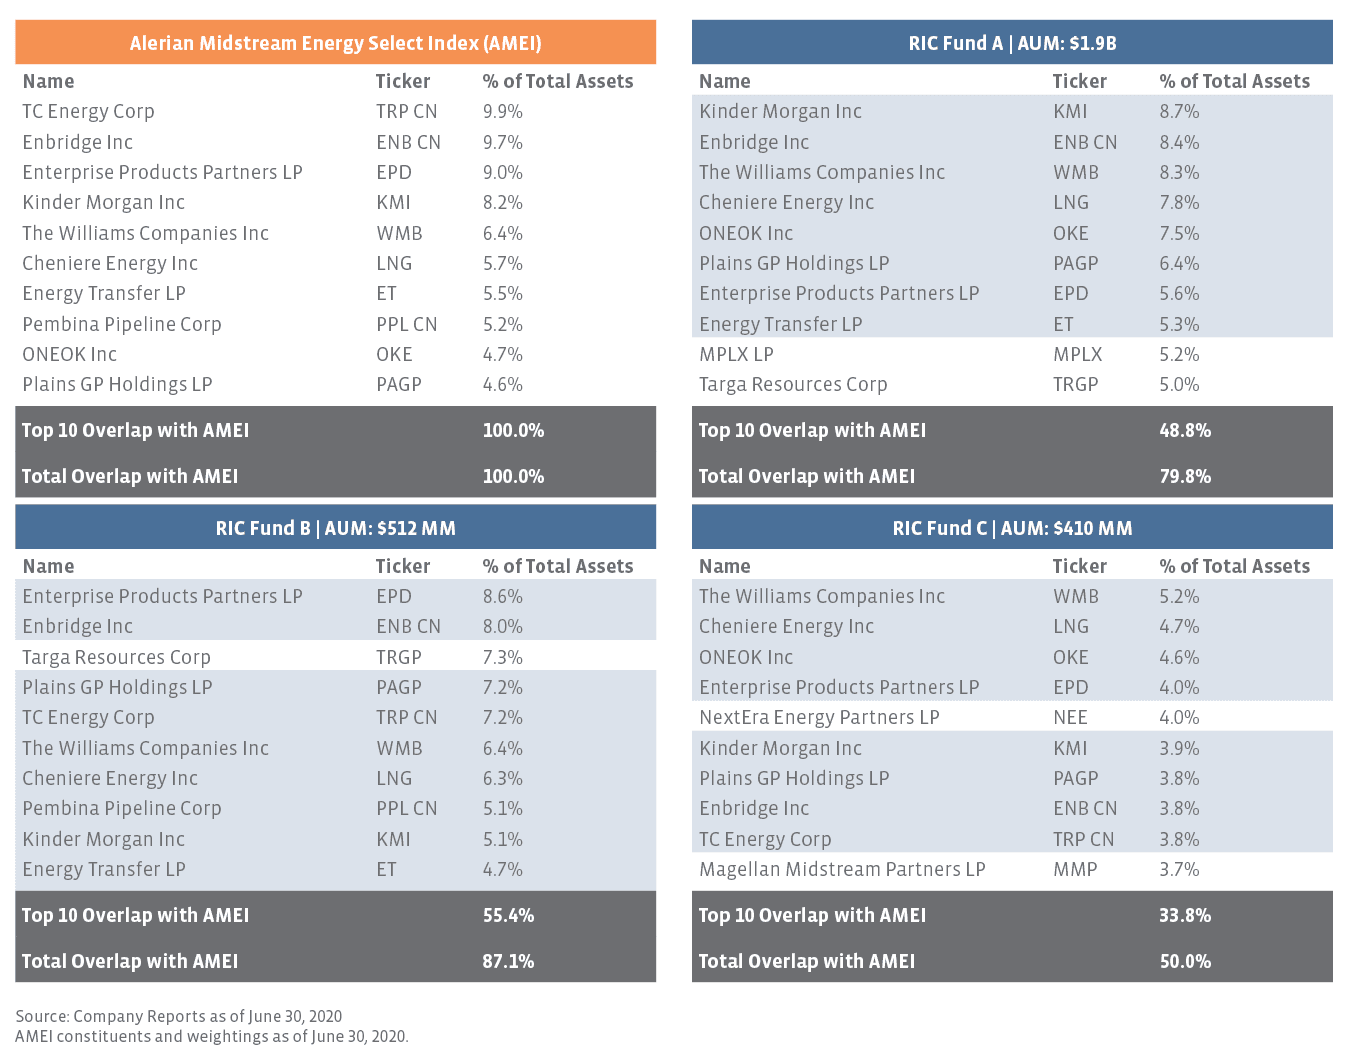
Limited investable universe leads to high fund overlap in some cases. One potential issue that can arise when investing in the midstream space is closet indexing, which occurs when an actively managed fund largely mirrors an index. Since many active funds have higher fees, closet indexing can result in similar or worse performance compared to a passive product at an increased cost. The most basic means of analyzing the similarity of an active fund and an index is by comparing the overlap of the constituents. The graphics below compare the top 10 holdings and total fund overlap for the three largest active funds in the two categories. C-Corp funds, given their high MLP exposure, are compared to the Alerian MLP Index (AMZ). RIC-compliant funds are compared to the broader Alerian Midstream Energy Select Index (AMEI), which contains 25% MLPs and 75% North American midstream C-Corps and serves as an investable subset of the broad Alerian Midstream Energy Index (AMNA).


To summarize, overlap was modest for the C-Corp funds and heightened for the RIC-compliant funds. The AMZ has 29 midstream MLP constituents with a total market capitalization of $147 billion as of the end of August. At that time, the top 10 constituents had a market cap of $121 billion and represented 73.4% of the index by weighting. The small size of the MLP universe suggests a higher likelihood of overlap between passive and active funds, but this was not the case in part due to some ownership of C-Corps like Williams (WMB) and ONEOK (OKE), which are not in the AMZ. Where overlap is lower, the active fund may be investing in companies outside of midstream. Perhaps surprisingly given the ability to select from the broader midstream universe, the largest RIC-compliant funds had more significant similarity to the AMEI. In general, the biggest US and Canadian C-Corps frequently dominated the top holdings of these funds, leading to higher overlap with the index.
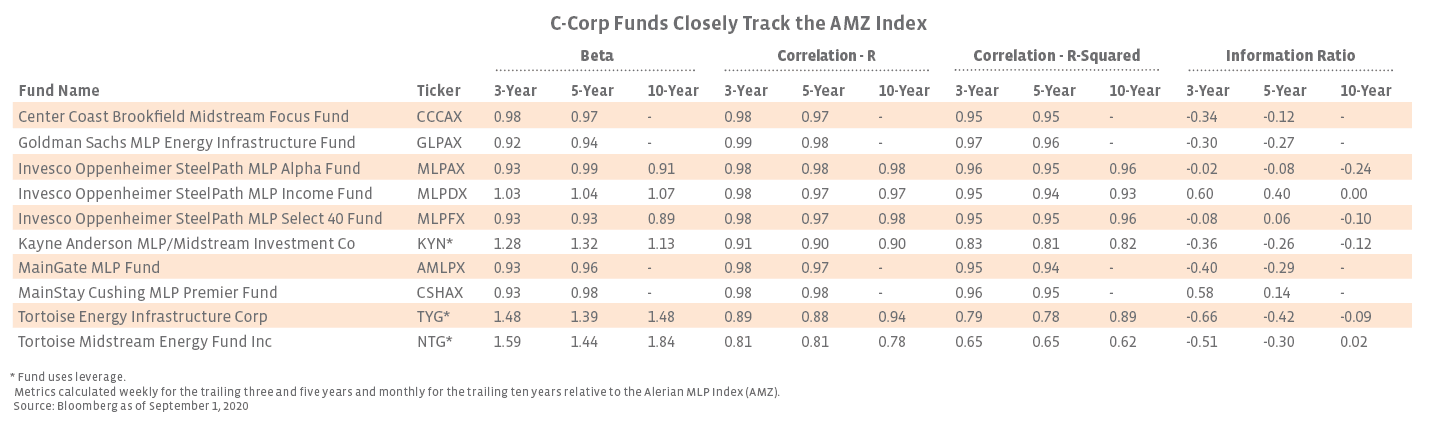
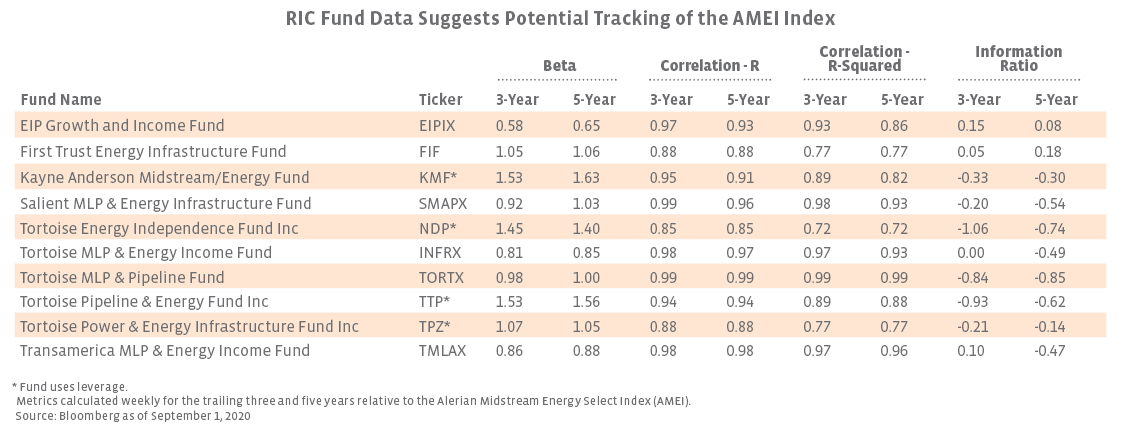
Tracking metrics indicate some active fund similarity to midstream indexes. In addition to looking at the overlap of fund constituents, analyzing tracking metrics can be helpful in determining how closely an active fund follows an index. The table below compares the beta, correlation (both R and R-squared), and information ratio for active funds relative to the AMZ and AMEI Indexes. In this context, beta measures the fund’s volatility relative to the benchmark, while R and R-squared measure the strength of the correlation between the fund and the index. Information ratio is useful in determining excess returns compared to the index by taking excess return divided by tracking error. A beta closer to 1.0 and a high R-squared value are more likely to indicate closet indexing. For the 10 C-Corp funds analyzed, the average beta was 1.10 with average R-squared of 0.89 for the five-year period. An R-squared value of 0.89 means that 89% of the fund movements can be explained by changes in the benchmark AMZ. Similarly, the RIC funds had an average five-year beta of 1.11 and an average R-squared value of 0.86. These metrics suggest a strong relationship between the funds and the index, with betas higher than 1.0 also indicating a potentially increased level of risk relative to the benchmark. While some funds were able to produce positive information ratios, the broader group was not able to generate excess returns relative to the index. Taking into account both the presence of some constituent overlap as well as relatively high correlations and other tracking metrics, active funds show similarity to their benchmark indexes.


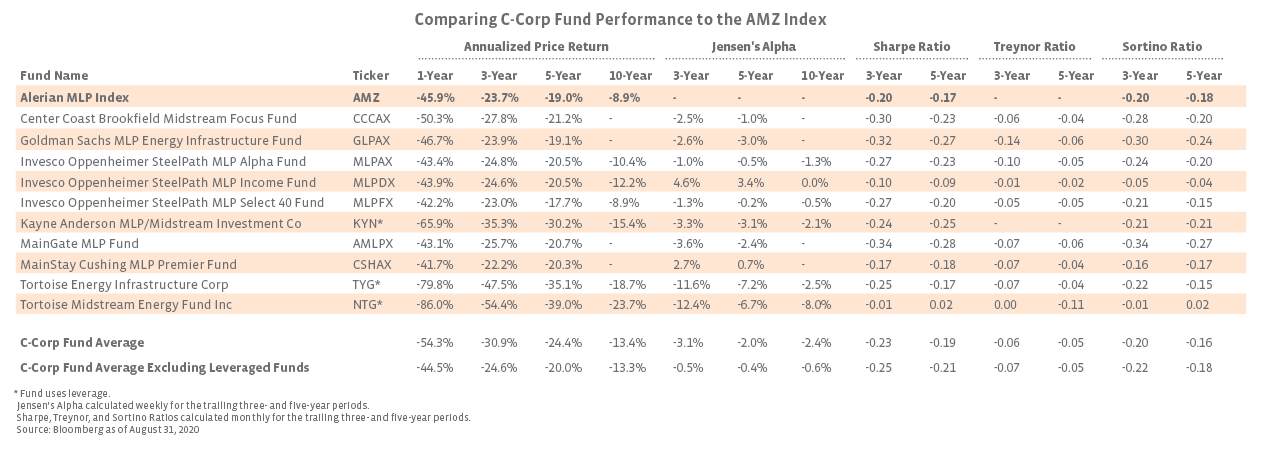
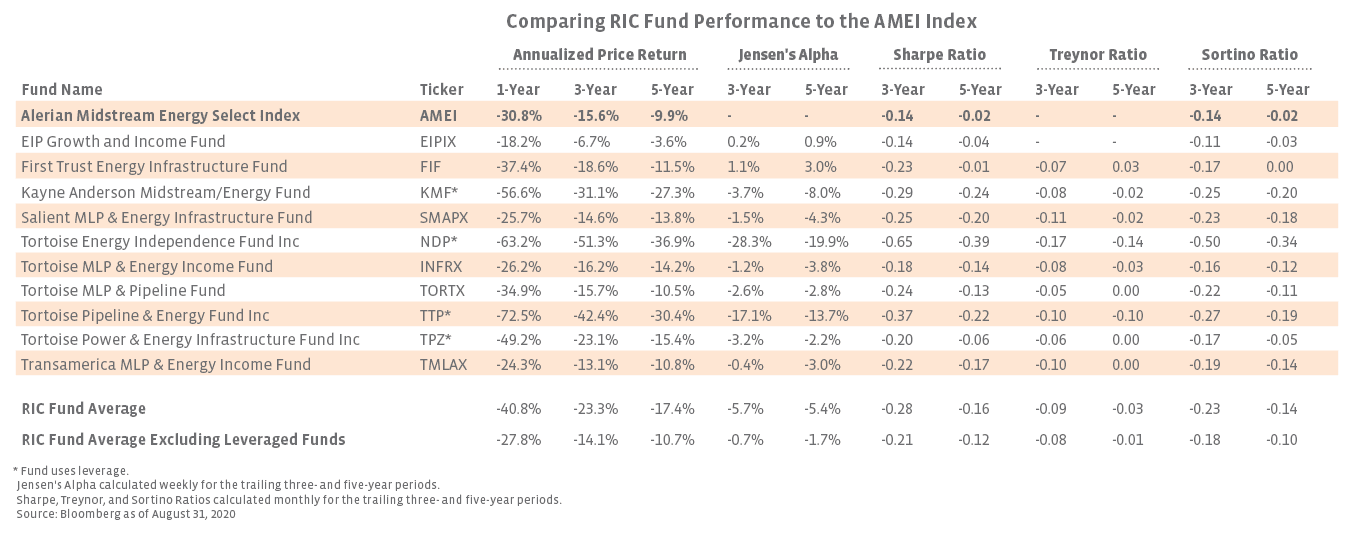
How do active funds compare in terms of performance? The analysis below compares performance and risk-return metrics for the ten largest funds by assets under management for each fund structure compared to the two most widely used C-Corp and RIC midstream fund benchmarks, the AMZ and AMEI. In general, the largest C-Corp funds have a longer track record and were more likely to have ten-year analytics available than the RIC funds. Closed-end funds, which deploy leverage, stand out in the tables below for having the weakest performance as leverage magnified the downside move in equities. Excluding the funds using leverage, C-Corp funds outperformed the AMZ on a price-return basis over the one-year period but lagged over both five and ten years. Similarly, the RIC funds without leverage had higher price returns than the index on average over the one-year and three-year periods but were weaker over five years. Jensen’s alpha is a measure that can be used to examine performance above the theoretical expected return. For the C-Corp and RIC funds, Jensen’s alpha was slightly negative on average, with many of the funds not generating excess returns at the given level of risk. In addition to Jensen’s alpha, the Sharpe, Treynor, and Sortino ratios help to analyze the risk-adjusted performance of the funds. In general, both the C-Corp and RIC funds were unable to outperform the index as a group when adjusting for risk, even over shorter periods. While a few individual active funds showed some degree of outperformance, the difficulty in consistently beating the index over long periods and higher fees on the active side make a strong case for considering passive products when investing in midstream.


Bottom Line While the aim of active investing to consistently outperform a market benchmark on a risk-adjusted basis is enticing, many midstream funds fail to consistently generate superior returns after fees over the long term. The limited number of investable midstream MLPs makes it even more challenging for products owning predominately MLPs to beat an index. Passive exchange-traded products generally provide lower fees and less turnover but carry some nuances as well. The active versus passive debate will undoubtedly continue with midstream investors having to decide which method they prefer. For those investors grappling with the debate, today’s note provides food for thought.

