ETFdb Logo
ETFdb Logo
  • ETF Database
  • Channels
    • Themes
      • Active ETF
      • Artificial Intelligence
      • Beyond Basic Beta
      • China Insights
      • Climate Insights
      • Core Strategies
      • Crypto
      • Direct Indexing
      • Disruptive Technology
      • Energy Infrastructure
      • ETF Building Blocks
      • ETF Investing
      • ETF Education
      • ETF Strategist
      • Financial Literacy
      • Fixed Income
      • Free Cash Flow
      • Innovative ETFs
      • Institutional Income Strategies
      • Leveraged & Inverse
      • Managed Futures
      • Market Insights
      • Modern Alpha
      • Multifactor
      • Responsible Investing
      • Retirement Income
      • Tax Efficient Income
    • Asset Class
      • Equity
        • U.S. Equity
        • Int'l Developed
        • Emerging Market Equities
      • Alternatives
        • Commodities
        • Gold/Silver/Critical Minerals
        • Currency
        • Volatility
      • Fixed Income
        • Investment Grade Corporates
        • US Treasuries & TIPS
        • High Yield Corporates
        • Int'l Fixed Income
    • ETF Ecosystem
    • ETFs in Canada
  • Tools
    • ETF Screener
    • ETF Country Exposure Tool
    • ETF Sector Tracker Tool
    • ETF Database Categories
    • Head-To-Head ETF Comparison Tool
    • ETF Stock Exposure Tool
    • ETF Issuer Fund Flows
    • Indexes
    • Mutual Fund To ETF Converter
  • Research
    • ETF Education
    • Equity Investing
    • Dividend ETFs
    • Leveraged ETFs
    • Inverse ETFs
    • Index Education
    • Index Insights
    • Top ETF Sectors
    • Top ETF Issuers
    • Top ETF Industries
  • Webcasts
  • Themes
    • AI ETFs
    • Blockchain ETFs
    • See all Thematic Investing ETF themes
    • ESG Investing
    • Marijuana ETFs
  • Multimedia
    • ETF 360 Video Series
    • ETF of the Week Podcast
    • ETF Prime Podcast
    • Video
  • Company
    • About VettaFi
    • Get VettaFi’ed
  • PRO
    • Pro Content
    • Pro Tools
    • Advanced
    • FAQ
    • Pricing
    • Free Sign Up
    • Login
  1. Index Insights
  2. Framing Current Midstream/MLP Yields with Stress Tests
Index Insights
Share

Framing Current Midstream/MLP Yields with Stress Tests

Michael LaitkepJul 15, 2020
2020-07-15

Summary

  • Despite the decrease in midstream yields in recent months, yields for both the Alerian MLP Infrastructure Index (AMZI) and the Alerian Midstream Energy Select Index (AMEI) are above their historical averages at 12.5% and 8.8%, respectively, as of July 10.
  • Given improved financial positioning entering the current downturn and with most needed dividend cuts likely completed, midstream income appears to be more durable today.
  • Even in a stress test, midstream maintains a considerable yield advantage over REITs and Utilities.

After several cuts in 1Q20 payouts, midstream dividends today seem much more durable. However, yields remain elevated relative to history given ongoing weakness in equity performance. As mentioned in Tuesday’s note, we view dividend cuts as less likely for 2Q20. While still early, seven names have already announced that they are maintaining their payouts. Today’s piece examines current midstream yields relative to the highs from March at the index and company level. Additionally, current yields and a stress test of those yields are compared to the payouts from other income-oriented sectors.

Yields remain elevated after pulling back from record highs in mid-March.
One way of telling the story of midstream in 2020 so far is through yields, which have historically been an important consideration for income-focused investors looking at the space. On March 18, the yields of both the Alerian MLP Infrastructure Index (AMZI) and the Alerian Midstream Energy Select Index (AMEI) reached all-time highs of 25.3% and 15.2%, respectively (see chart below). March 18 also represented an absolute bottom for both indexes, with each down more than 60% on a price performance basis year-to-date through March 18. From mid-March through early June, yields decreased to their lowest levels since late January on the back of a significant equity price rally in addition to announced dividend cuts for many companies, particularly smaller names (read more). From the index low on March 18 to the relative high on June 8, the AMZI and AMEI surged 130.4% and 111.0%, respectively, on a price-return basis. Yields have since risen slightly as the energy rally has stalled out on concerns about the potential impact on demand from increasing case numbers of COVID-19 and regulatory headwinds such as the potential shutdown of the Dakota Access Pipeline (discussed more below), which has far-reaching implications for producers, refiners, and other stakeholders beyond the pipeline’s owners. As of July 10, the AMZI Index and AMEI Index were yielding 12.5% and 8.5%, respectively. Placing current yields in context relative to history, the three-year average yield for the AMZI is 8.8% as of July 10, while the three-year average yield for the AMEI is 6.5%. Clearly, yields for both indexes are still well above their historical averages.

This is the image alt text

Top 10 AMZI and AMEI constituents highlight resilience among larger names.
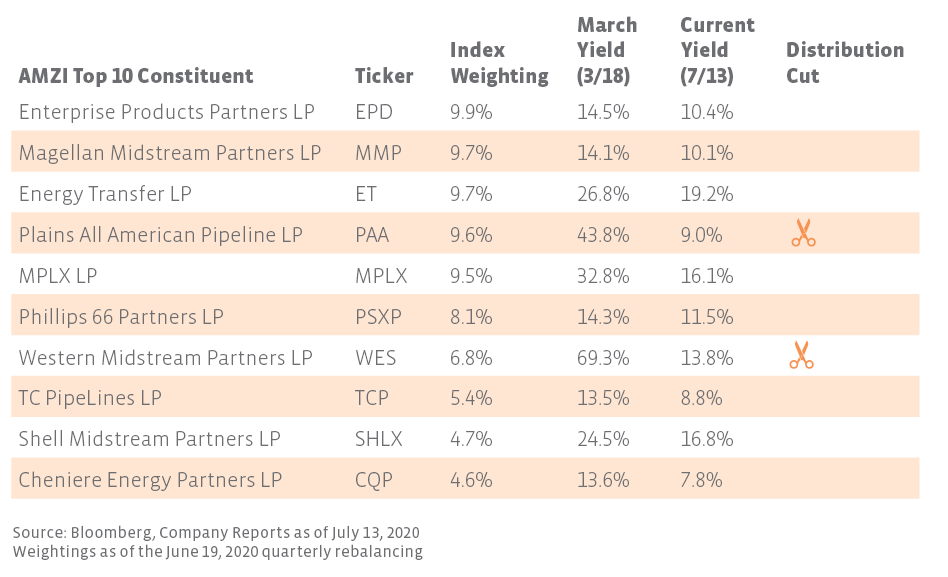
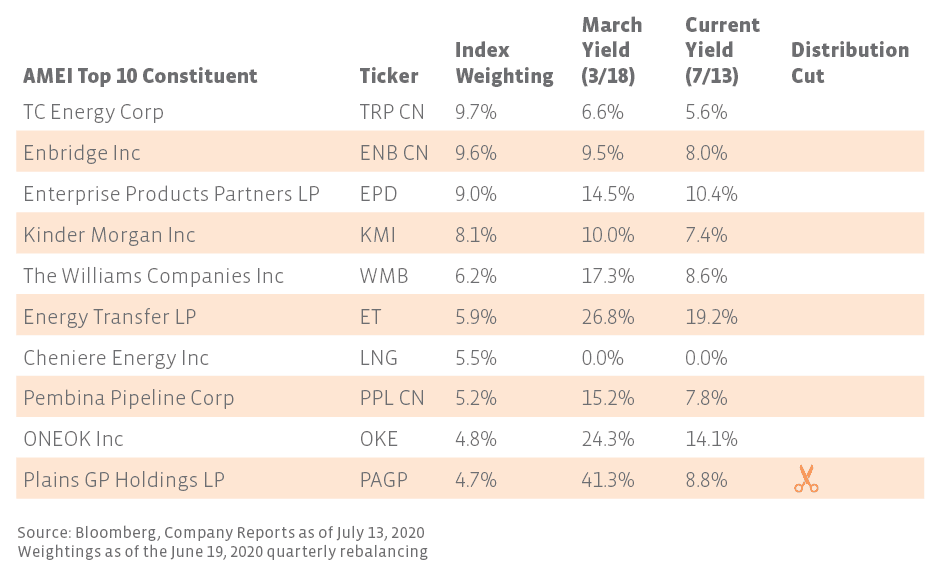
Focusing on the names with the greatest weighting in each index provides context for how yields have moved since March. The tables below compare yields on March 18 against current yields as of July 13 for the top ten names in the AMZI and AMEI indexes. Notably, for the AMZI, the companies with the highest yield spikes in March – Plains All American (PAA/PAGP) and Western Midstream (WES) – were also the two MLPs in the top ten that cut their distributions for the first quarter, indicating heightened investor expectations of a cut. There were 12 distribution cuts in the AMZI and 14 cuts in the AMEI for 1Q20, although 68.5% of the AMZI and 74.5% of the AMEI by weighting grew or maintained their dividends. While additional cuts are possible, we view cuts as less likely overall for this quarter and believe most midstream companies that needed to cut their dividends have likely done so at this point.


Content continues below advertisement

This is the image alt text

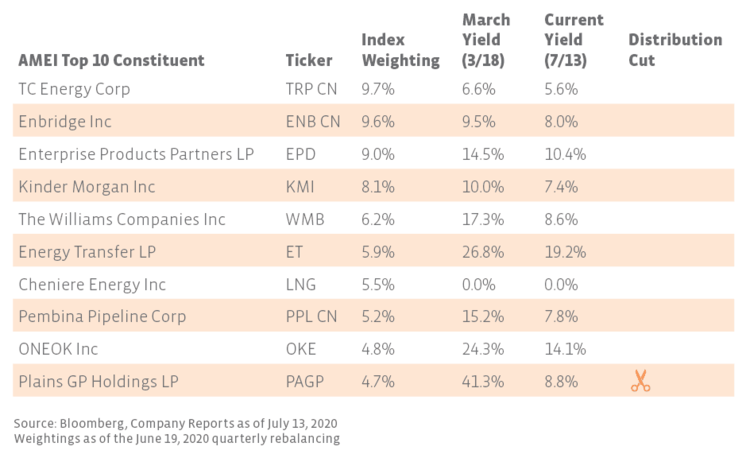
Among AMEI’s top ten constituents, PAGP represented the only dividend cut for 1Q20. Notably, the yields of Canadian C-Corps TC Energy (TRP CN) and Enbridge (ENB CN) have not experienced as much volatility and did not even reach double-digits as the space bottomed. The stability is not surprising considering their defensive performance within midstream (read more). Year to date through July 13, TRP CN and ENB CN have only fallen -17.0% and -21.8% on a price-return basis, respectively, compared to -36.4% for the AMEI. Relative to the other top ten constituents, Energy Transfer’s (ET) yield remains elevated at 19.2% as of July 13. ET has had to contend lately with uncertainty related to a potential shutdown of the jointly owned Dakota Access Pipeline (DAPL), which transports crude out of the Bakken. Last week, Moody’s revised its outlook on ET’s Baa3 investment grade rating to negative and pointed out the risks to earnings that would be caused by a prolonged halt of DAPL. On Wednesday, a federal appellate court temporarily stayed the order for DAPL to shut down while the case is being reviewed.

This is the image alt text

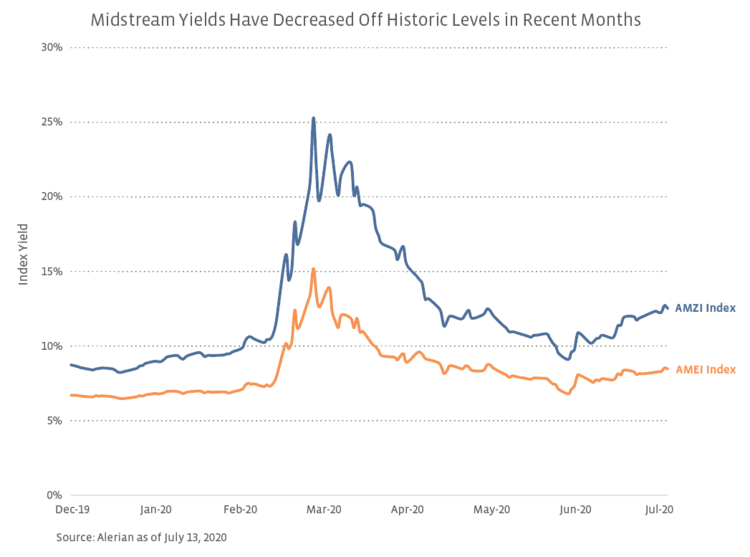
Yields reflect individual company situations and risk profiles, with factors such as financial positioning, contract protections, and geographic exposure to certain basins contributing to performance and yield levels. Overall, company yields have eased, though they are still loftier than they were prior to the pandemic and relative to history. In general, dividends have proven resilient for the top constituents in each index, with most large companies maintaining their dividends (read more).

Updated stress tests show midstream maintains a yield advantage even in draconian scenarios.
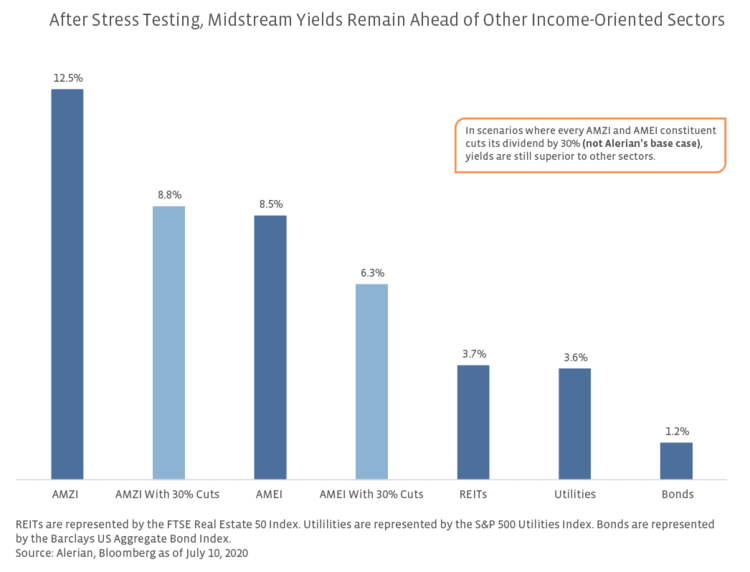
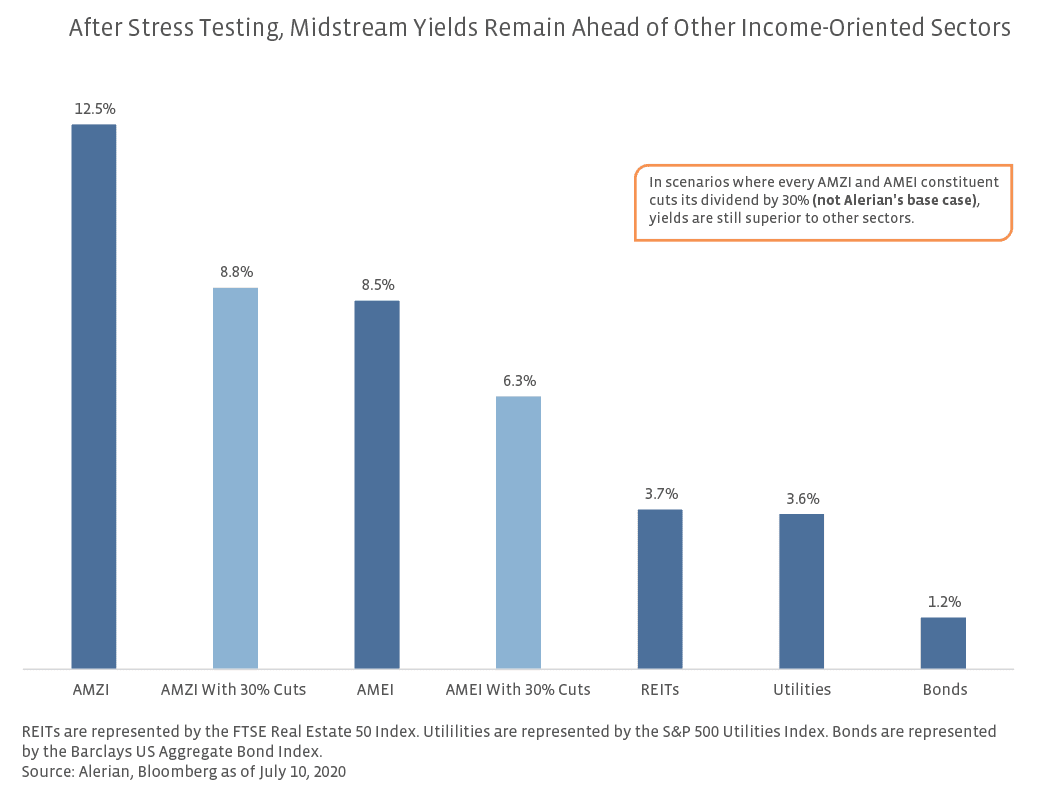
With midstream yields coming down as a result of improved equity performance and some dividend cuts for 1Q20, we are updating the AMZI and AMEI yield stress test scenarios introduced in March to look at how midstream yields would compare to other income-oriented sectors under hypothetical 2Q20 dividend cut scenarios. The scenario tests assume all constituents in each index cut their dividends by an additional 30% on top of what has already been announced for 1Q20. Cuts are assumed even for names that have already announced dividends. To date, PAA/PAGP, Enterprise Products Partners (EPD), Genesis Energy (GEL), Antero Midstream (AM), Keyera (KEY CN), Pembina Pipeline (PPL CN), and Inter Pipeline (IPL CN) have already announced they are maintaining their dividends for 2Q20 or for July 2020 if paid monthly. Please note these stress tests are designed for illustrative purposes only and do not represent Alerian’s base case. To reiterate, Alerian views cuts as less likely overall for 2Q20 and believes necessary cuts have largely been announced. In the charts below, the base index yields are current as of July 10 and incorporate all announced dividend cuts. The chart compares the two midstream indexes and their stress tests with other notable income-oriented sectors – REITs, Bonds, and Utilities.

For the AMZI, index yields are well above the other income sectors in the comparison. Assuming an additional 30% distribution cut for the constituents of the index, the AMZI would yield greater than 500 basis points more than REITs and Utilities. Shifting gears, the AMEI has a lower yield than the AMZI due to the 25% cap on MLPs. However, AMEI’s yield is still generous relative to other income-oriented investments. Even a hypothetical 30% reduction in dividends for AMEI constituents would result in a yield advantage of over 200 basis points versus REITS and Utilities. Whether looking solely at MLPs (AMZI) or broader midstream (AMEI), the income advantage for midstream is significant – even when stress tested.

This is the image alt text

Bottom Line
Midstream yields remain at elevated levels and are considerably greater than other income-oriented sectors. In an environment of low interest rates, the attractiveness of midstream yields may give investors a reason to take another look at the space. Given improved financial positioning entering the current downturn and with most needed dividend cuts likely already completed, midstream income appears to be more durable today, and even stress tested yields are generous. Mathematically speaking,  yields should fall as performance improves and macro headwinds and uncertainty subside. With the income for the space more durable today after significant cuts in 1Q20, a further reduction in yields is expected to be driven by better performance as opposed to more dividend cuts.

» Popular Pages

  • Tickers
  • Articles

Sep 28

Andrew Beer: Avoid the “Worst Heuristic Bias” in Investing

Sep 28

Today's Economy is a Gift to High Yield

Sep 28

The Quality Dividend ETF OUSM Is Nearing RSI Signal

Sep 28

BlackRock Lists Active Equity Premium Income ETF

Sep 28

Examining the Women Factor

Sep 28

Rising Water Costs Globally Spell Opportunity for This ETF

Sep 28

Harbor Commodity ETF Supported by Strong Tilt Toward Energy

Sep 28

VanEck Ethereum Futures ETF Could Launch Soon

Sep 28

Avantis Launches U.S. Large Cap Equity ETF

Sep 28

Capital Group Launches 5 New Active ETFs

QQQ

Invesco QQQ Trust Series I

SPY

SPDR S&P 500 ETF Trust

VOO

Vanguard S&P 500 ETF

JEPI

JPMorgan Equity Premium...

TLT

iShares 20+ Year Treasury...

VGT

Vanguard Information...

SCHD

Schwab US Dividend Equity ETF...

VTI

Vanguard Total Stock Market...

SDS

ProShares UltraShort S&P500

XLK

Technology Select Sector SPDR...

Loading Articles...
Our Sites
  • VettaFi
  • Advisor Perspectives
  • ETF Trends
Tools
  • ETF Screener
  • Mutual Fund to ETF Converter
  • Head-To-Head ETF Comparison
  • ETF Country Exposure Tool
  • ETF Stock Exposure Tool
  • ETF Database Pro
More Tools
  • Financial Advisor & RIA Center
Explore ETFs
  • ETF News
  • ETF Category Reports
  • Premium Articles
  • Alphabetical Listing of ETFs
  • Browse ETFs by ETF Database Category
  • Browse ETFs by Index
  • Browse ETFs by Issuer
  • Compare ETFs
Information
  • Contact Us
  • Terms of Use and Privacy Policy
  • © 2023 VettaFi LLC. All rights reserved.

Advertisement

Is Your Portfolio Positioned With Enough Global Exposure?

ETF Education Channel

How to Allocate Commodities in Portfolios

Tom LydonApr 26, 2022
2022-04-26

A long-running debate in asset allocation circles is how much of a portfolio an investor should...

Core Strategies Channel

Why ETFs Experience Limit Up/Down Protections

Karrie GordonMay 13, 2022
2022-05-13

In a digital age where information moves in milliseconds and millions of participants can transact...

}
X