ETFdb Logo
ETFdb Logo
  • ETF Database
  • Channels
    • Active ETF
    • Alternatives
    • Beyond Basic Beta
    • China Insights
    • Climate Insights
    • Commodities
    • Core Strategies
    • Crypto
    • Disruptive Technology
    • Dividend
    • Dual Impact
    • Emerging Markets
    • Energy Infrastructure
    • ESG
    • ETF Building Blocks
    • ETF Education
    • ETF Strategist
    • Fixed Income
    • Free Cash Flow
    • Future ETFs
    • Global Diversification
    • Gold & Silver Investing
    • Innovative ETFs
    • Institutional Income Strategies
    • Leveraged & Inverse
    • Managed Futures
    • Market Insights
    • Megatrends
    • Modern Alpha
    • Multi-Asset
    • Night Effect
    • Portfolio Strategies
    • Retirement Income
    • Richard Bernstein Advisors
    • Tax Efficient Income
    • Thematic Investing
    • Volatility Resource
  • Tools
    • ETF Screener
    • ETF Country Exposure Tool
    • ETF Sector Tracker Tool
    • ETF Database Categories
    • Head-To-Head ETF Comparison Tool
    • ETF Stock Exposure Tool
    • ETF Issuer Fund Flows
    • Indexes
    • Mutual Fund To ETF Converter
    • ETF Data for Journalists
    • ETF Nerds
  • Research
    • First Bitcoin ETF
    • ETF Education
    • Equity Investing
    • Dividend ETFs
    • Leveraged ETFs
    • Inverse ETFs
    • Index Education
    • Index Insights
    • Top ETF Sectors
    • Top ETF Issuers
    • Top ETF Industries
  • Webcasts
  • Themes
    • AI ETFs
    • Blockchain ETFs
    • See all Thematic Investing ETF themes
    • ESG Investing
    • Marijuana ETFs
  • Multimedia
    • ETF 360 Video Series
    • ETF Trends on Videos
    • ETF Trends on Podcasts
    • ETF Prime Podcast
  • Company
    • About Us
    • Swag Store
  • PRO
    • Pro Content
    • Pro Tools
    • Advanced
    • FAQ
    • Pricing
    • Free Sign Up
    • Login
  1. Index Insights
  2. Income Opportunities: Examining Price and Total Return in 2021
Index Insights
Share

Income Opportunities: Examining Price and Total Return in 2021

Roxanna Islam, CFA, CAIAJan 05, 2022
2022-01-05

This is the image alt text


In a year when broad equity indexes like the S&P 500 posted an annual gain of close to 27%, it can be disappointing to see a portfolio with modest price returns. But price performance only tells part of the story—particularly when examining income-generating investments, which tend to perform better on a total return basis over long time periods. But because it is inevitable that many investors may focus on price performance as part of a year-end portfolio assessment, this note looks back at 2021 annual performance of several income indexes and examines price returns relative to total returns and distribution rates.

Introduction: why examining total return is important in a long-term time horizon.

Price return simply reflects the change in price and is widely used in media reports. For example, when the news quotes the S&P 500, they are usually referring to the price index and its price return. Unlike price return, total return reflects both price appreciation and the income generated from dividends and distributions. It is also important to remember that total-return indexes typically assume that all dividends are reinvested. Over longer time periods, dividend reinvestment increases compounding power to amplify returns—something that may not be obvious when looking at short-term performance.

To illustrate using a widely known market index, the chart below shows the S&P 500’s total return over the last 10 years. The S&P 500 is not considered an “income-oriented index,” given its ten-year average dividend yield of under 2%. So understandably, the difference between price performance and total- return performance of the S&P 500 is not that significant during a single year—during 2021, price return was 26.9% vs. a total return of 28.7%. But this is a good example because it reveals that even small dividend payments will add up over a period of several years. As seen below, S&P 500’s total return in the last 10 years is significantly higher than its price return during the same period when accounting for the impact of dividends over time.


Content continues below advertisement

2022-01-06 08_36_49-Income Opportunities

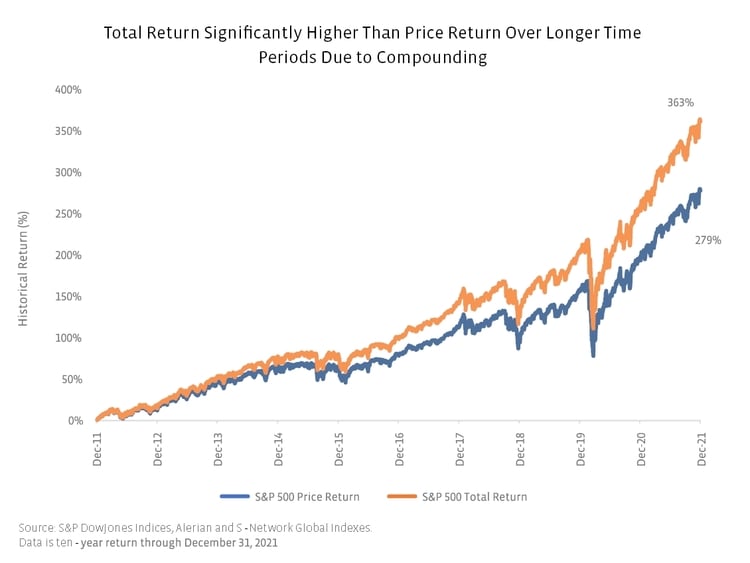
How did equity income indexes perform in 2021?

While all of the equity income indexes in the chart below provided positive price return in 2021, performance varied significantly. Given growing inflation concerns over the course of 2021, equity income investments with real asset exposure tended to provide standout performance, with REITs and midstream leading the way. Though Utilities also provide real asset exposure, the sector lagged the S&P 500 due in part to its more defensive characteristics, which are less desirable in a strong year for equities. The diversified equity income indexes below performed relatively in line with the broader market. Closed-end funds (CEFs) rounded out 2021 performance with modest price gains in the single-digits, though price returns tend to be less important as discussed below.

Dividend indexes were in line with the broader market on a total-return basis – Dividend indexes like the S-Network Durable Dividends US Large-Cap Index (SNDDX) and the S-Network Sector Dividend Dogs Index (SDOGX), which provide exposure to companies with higher dividend yields, should generally be evaluated using total returns. On a total-return basis in 2021, SNDDX and SDOGX were about in line with the S&P 500 as seen in the chart below. Some of the variance this year could also be attributed to the equity market rally, which seemed to favor high growth stocks, rather than value stocks. Many dividend paying companies, particularly those with higher yields included in these indexes, have a value tilt. Additionally, the equal sector-weighting of SDOGX provides more exposure to value-oriented sectors like energy and less exposure to growth sectors like information technology than broad market benchmarks.

Generous payouts and energy recovery drove midstream outperformance in 2021 – Flush with free cash flow, the midstream space (including midstream MLPs) offers generous payouts and attractive yields in today’s low-yielding environment (see the most recent midstream dividend report here). All else equal, higher payouts can potentially enhance the total return profile. Additionally, midstream participated in a broad energy recovery as commodity prices improved during the year, which resulted in outperformance relative to the S&P 500 on a price-return basis. Midstream significantly outperformed on a total-return basis as it benefited from an 8-11% return contribution from dividends.

CEFs focus less on price and more on income generation – Price returns for CEF indexes were lower than other income indexes, but distributions contributed significantly to total return. Price is arguably less important for CEFs than it is for traditional income stocks. Many CEFs pay out the majority of their earnings as distributions and keep their NAV generally stable (and price tracks NAV). Over short time periods, decreases in NAV (and therefore price return) may occur if unrealized earnings are used to fund distributions, which is not uncommon. But long-term, total return should be greater or equal to the distribution rate—otherwise this could indicate that distributions have been eating into the original invested principal.

2022-01-06 08_38_12-Income Opportunities

This is the image alt text


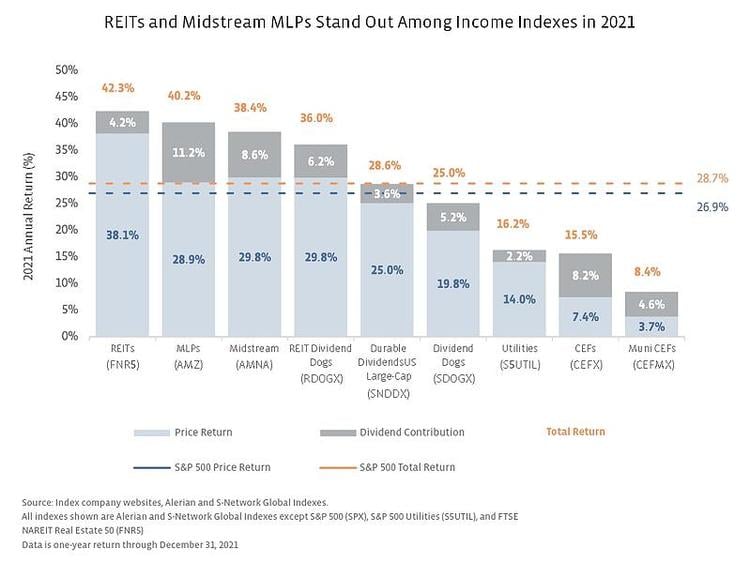
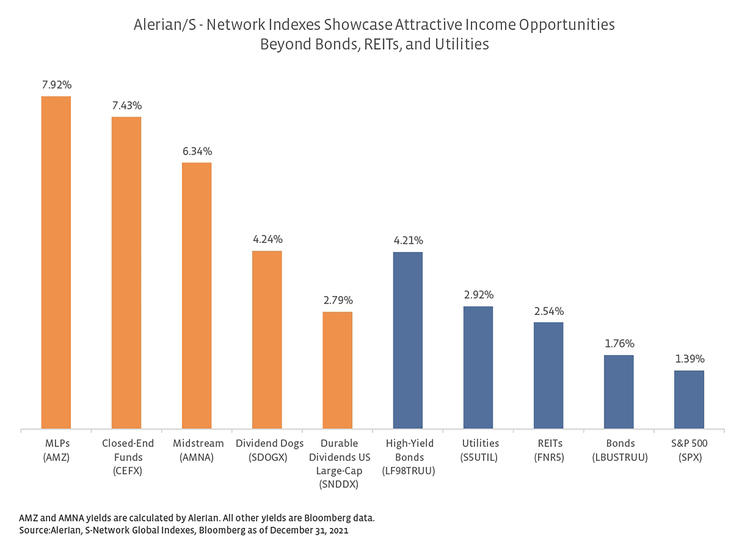
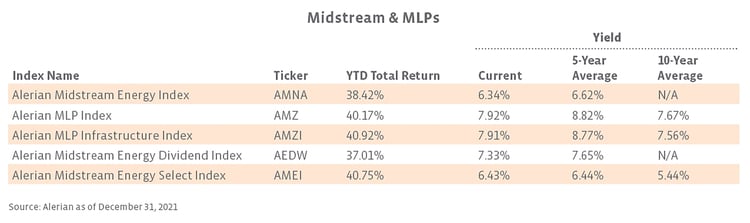
Current Yields vs. History

Midstream/MLPs offer attractive yields and provided a strong total return in 2021. Yields are slightly below five-year averages but marginally higher than ten-year averages.

Midstream and MLPs


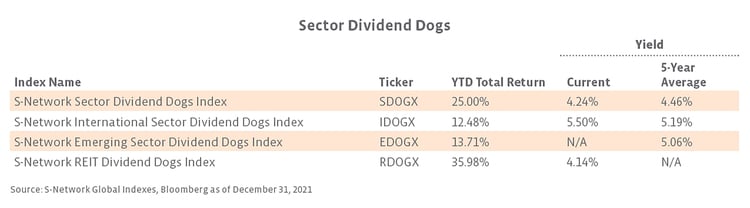
Yields offered by Sector Dividend Dogs are about in line with historical averages, with double-digit total returns in 2021.

Sector Dividend Dogs Revised


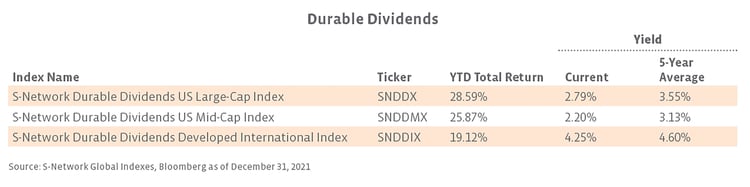
Multiple screens for dividend durability, including evaluating cash flows, EBITDA, and debt-to-equity ratios, help ensure reliable income from the durable dividend indexes.

Durable Dividends


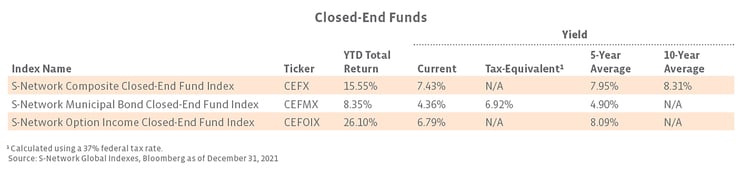
Though current yields are slightly below historical averages, closed-end funds continue to represent an attractive option for enhancing the yield of an income-oriented portfolio.

Closed End Funds Revised


Related research:

Income Opportunities with Real Assets

Income Opportunities: Finding Income in an Inflationary Environment

3Q21 Midstream Dividends: No Cuts, Growth Profile Improving

Income Opportunities: High Yields Don’t Have to Mean Low Quality

Income Opportunities: Offsetting Low Yields in a Portfolio

This is the image alt text


» Popular Pages

  • Tickers
  • Articles

Jan 27

ETF Issuer League: JPMorgan ETFs Almost $100 Billion

Jan 27

Main Management Market Note: January 27, 2023

Jan 27

As Recession Signals Grow, Turn to Risk-Managed ETFs

Jan 27

HGER Acts as a Compelling Solution for Inflation

Jan 27

Mutual Fund-to-ETF Conversions: The Future in 4 Charts

Jan 27

American Century ETF Duo Hits Key Buy Signals Friday

Jan 27

ACES and AMLP Aid Investing in the Energy Transition

Jan 27

Target Long Duration, High Quality Fixed Income

Jan 27

The Sharpe-r Way to Invest

Jan 27

Structure Matters: Volatility May Make 60/40 Unclear

QQQ

Invesco QQQ Trust

SPY

SPDR S&P 500 ETF Trust

VOO

Vanguard S&P 500 ETF

VGT

Vanguard Information...

SMH

VanEck Semiconductor ETF

XLK

Technology Select Sector SPDR...

VTI

Vanguard Total Stock Market...

SOXX

iShares Semiconductor ETF

BLOK

Amplify Transformational Data...

META

Roundhill Ball Metaverse ETF

Loading Articles...
Help & Info
  • Contact Us
Tools
  • ETF Screener
  • ETF Analyzer
  • Mutual Fund to ETF Converter
  • Head-To-Head ETF Comparison
  • ETF Country Exposure Tool
  • ETF Stock Exposure Tool
  • ETF Performance Visualizer
  • ETF Database Model Portfolios
  • ETF Database Realtime Ratings
  • ETF Database Pro
More Tools
  • ETF Launch Center
  • Financial Advisor & RIA Center
  • ETF Database RSS Feed
Explore ETFs
  • ETF News
  • ETF Picks of the Month
  • ETF Category Reports
  • Premium Articles
  • Alphabetical Listing of ETFs
  • Best ETFs
  • Browse ETFs by ETF Database Category
  • Browse ETFs by Index
  • Browse ETFs by Issuer
  • Compare ETFs
Legal
  • Terms of Use and Privacy Policy
  • © 2023 VettaFi LLC. All rights reserved.
Follow ETF Database
Follow ETF Database

Advertisement

Is Your Portfolio Positioned With Enough Global Exposure?

ETF Education Channel

How to Allocate Commodities in Portfolios

Tom LydonApr 26, 2022
2022-04-26

A long-running debate in asset allocation circles is how much of a portfolio an investor should...

Core Strategies Channel

Why ETFs Experience Limit Up/Down Protections

Karrie GordonMay 13, 2022
2022-05-13

In a digital age where information moves in milliseconds and millions of participants can transact...

}
X