ETFdb Logo
  • ETF Database
  • Content Hubs
    • Themes
      • Active ETF
      • Alternatives
      • Artificial Intelligence
      • China Insights
      • Core Strategies
      • Crypto
      • Disruptive Technology
      • Energy Infrastructure
      • ETF Building Blocks
      • ETF Investing
      • ETF Strategist
      • Financial Literacy
      • Fixed Income
      • Free Cash Flow
      • Future ETFs
      • Innovative ETFs
      • Institutional Income Strategies
      • Leveraged & Inverse
      • Market Insights
      • Market Outlooks
      • Modern Alpha
      • Nuclear Energy
      • Portfolio Strategies
      • Sector Investing
      • Tax Efficient Income
      • Thematic Investing
    • Asset Class
      • Equity
        • U.S. Equity
        • Int'l Developed
        • Emerging Market Equities
      • Alternatives
        • Gold/Silver/Critical Materials
        • Cryptocurrency
        • Currency
        • Volatility
      • Fixed Income
        • Investment Grade Corporates
        • US Treasuries & TIPS
        • High Yield Corporates
        • Int'l Fixed Income
    • ETF Ecosystem
    • ETFs in Canada
    • Market Outlook
    • Crypto ETF Hub
  • Tools
    • ETF Screener
    • ETF Country Exposure Tool
    • ETF Database Categories
    • Indexes
    • Scenario Analysis
    • Watchlists
    • Head-To-Head ETF Comparison Tool
    • Mutual Fund To ETF Converter
    • ETF Stock Exposure Tool
    • ETF Issuer Fund Flows
  • Research
    • ETF Education
    • Equity Investing
    • Dividend ETFs
    • Leveraged ETFs
    • Inverse ETFs
    • Index Education
    • Index Insights
    • Top ETF Sectors
    • Top ETF Issuers
    • Top ETF Industries
  • Webcasts
  • Sectors
    • Sector Investing Content Hub
    • XLK
    • XLI
    • XLU
    • XLY
    • XLP
    • XLRE
    • Sector Power Rankings
    • XLE
    • XLC
    • XLF
    • XLV
    • XLB
  • Multimedia
    • ETF 360 Video Series
    • ETF of the Week Podcast
    • Gaining Perspective Podcast
    • ETF Prime Podcast
    • Video
  • Company
    • About VettaFi
  • PRO
    • Pro Content
    • Pro Tools
    • Advanced
    • FAQ
    • Free sign up
    • Login
  1. Index Insights
  2. Just Happened: Spectra Analyst Day
Index Insights
Share

Just Happened: Spectra Analyst Day

Kenny FengFeb 05, 2015
2015-02-05

It must feel good when your stock trades up 4.4% on the day that you host your analyst meeting. Executives are excited that investors like their plan for the future, IR personnel are happy that their presentation conveyed that plan effectively, and employees are enthusiastic about having a plan that they can get behind. What did Spectra Energy Corporation (SE) CEO Greg Ebel and his team do right? Let’s take a look (slide presentation here).

Spectra Slide 5


Content continues below advertisement

Spectra Slide 15

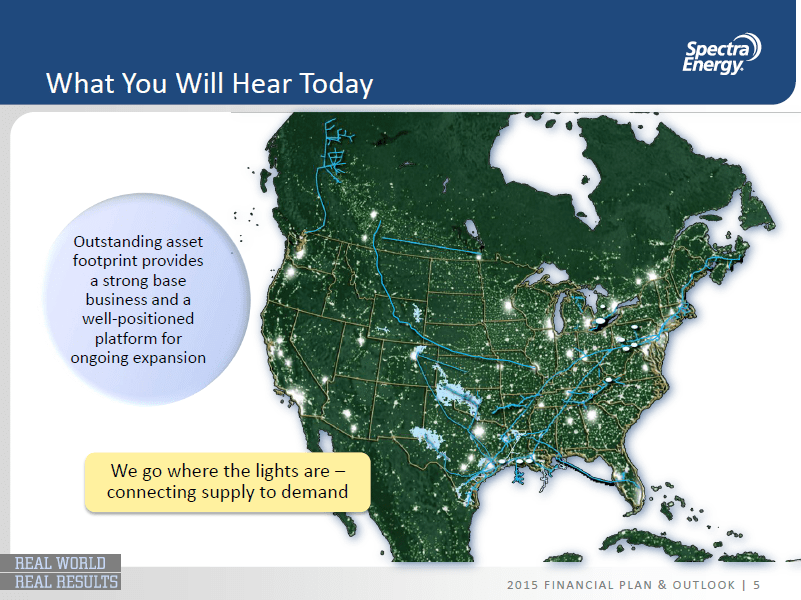
The Earth at Night map is both stunning and informative (additional evidence available here courtesy of the Suomi NPP). But what does that have to do with Spectra? A lot, when you overlay the company’s asset footprint and include the statement, “We go where the lights are.” Because the lights are generally concentrated in metropolitan areas, i.e. demand centers, and few expect energy demand to stop growing anytime soon, the implication is that SE’s plan to grow its dividend by 8%-9% per year through 2017 is secure because it is not dependent on the supply of US oil production continuing to grow and/or commodity prices rebounding.

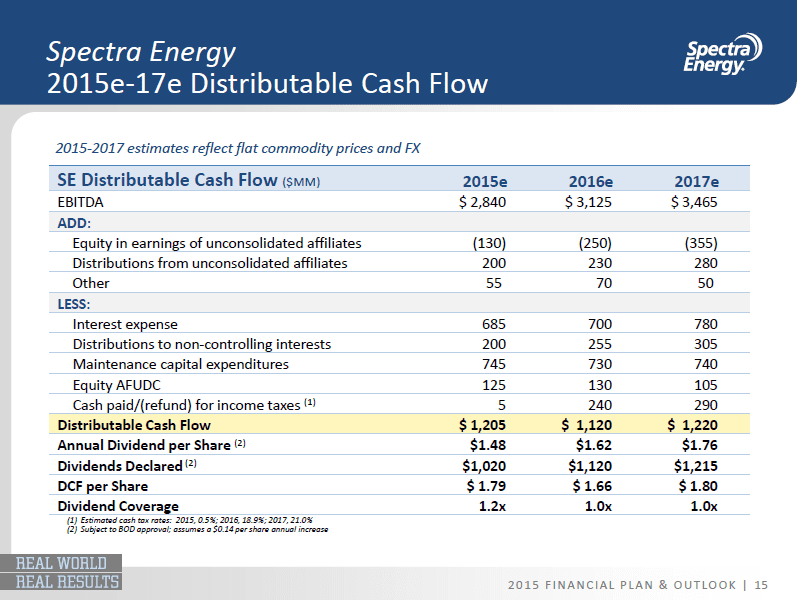
The skeptic might point out on the second slide that Spectra is planning to grow its dividend over the next few years not by generating more distributable cash flow, but by taking its coverage ratio down to 1.0 times, leaving little room for error. That means regulatory approvals need to be secured and projects need to be completed on time and on budget at Spectra Energy Partners (SEP). Volumes need to meet expectations on fee-based contracts. And the loonie needs to strengthen a bit against the US dollar. So why don’t investors seem to be more concerned? Because the whole point of having a coverage ratio is to protect the company from events within two standard deviations, not for it to be constant throughout the business cycle. If a company stays meaningfully above 1.0 times in stress tests like the current environment, management might want to consider paying out more cash to investors. If coverage falls below 1.0 times, management likely wasn’t conservative enough in its scenario analysis.

» Popular Pages

  • Tickers
  • Articles

Jun 25

American Century’s Gotelli Talks Muni Bond Trends

Jun 25

Qualcomm Data Center Plans Put These ETFs in the Spotlight

Jun 25

Emerging Markets See Historical Discount: Get Exposure in GSEE

Jun 25

How AI Turned Infrastructure Into a Must-Own Asset

Jun 25

Two Measures of Inflation: May 2026

Jun 25

Advanced Nuclear Power Projects: Commercial SMR Deals Boost NUKZ

Jun 25

ETF of the Week: T. Rowe Price Value ETF (TVAL)

Jun 25

What Rising Structural Inflation Means for Your Bond Portfolio

Jun 25

Capturing the Memory Boom: How ETFs Are Winning With Micron

Jun 25

ETF Prime: The SpaceX IPO & MANGOS ETFs

QQQ

Invesco QQQ Trust Series I

VOO

Vanguard S&P 500 ETF

GLD

SPDR Gold Shares

DRAM

Roundhill Memory ETF

SMH

VanEck Semiconductor ETF

SOXX

iShares Semiconductor ETF

PPLT

abrdn Physical Platinum...

SIVR

abrdn Physical Silver Shares...

SCHD

Schwab US Dividend Equity ETF...

SOXL

Direxion Daily Semiconductor...

Loading Articles...

Advertisement

Is Your Portfolio Positioned With Enough Global Exposure?

ETF Education Channel

How to Allocate Commodities in Portfolios

Tom LydonApr 26, 2022
2022-04-26

A long-running debate in asset allocation circles is how much of a portfolio an investor should...

Core Strategies Channel

Why ETFs Experience Limit Up/Down Protections

Karrie GordonMay 13, 2022
2022-05-13

In a digital age where information moves in milliseconds and millions of participants can transact...

}
X