ETFdb Logo
ETFdb Logo
  • ETF Database
  • Channels
    • Themes
      • Active ETF
      • Artificial Intelligence
      • Beyond Basic Beta
      • China Insights
      • Climate Insights
      • Core Strategies
      • Crypto
      • Direct Indexing
      • Disruptive Technology
      • Energy Infrastructure
      • ETF Building Blocks
      • ETF Investing
      • ETF Education
      • ETF Strategist
      • Financial Literacy
      • Fixed Income
      • Free Cash Flow
      • Innovative ETFs
      • Institutional Income Strategies
      • Leveraged & Inverse
      • Managed Futures
      • Market Insights
      • Modern Alpha
      • Multifactor
      • Responsible Investing
      • Retirement Income
      • Tax Efficient Income
    • Asset Class
      • Equity
        • U.S. Equity
        • Int'l Developed
        • Emerging Market Equities
      • Alternatives
        • Commodities
        • Gold/Silver/Critical Minerals
        • Currency
        • Volatility
      • Fixed Income
        • Investment Grade Corporates
        • US Treasuries & TIPS
        • High Yield Corporates
        • Int'l Fixed Income
    • ETF Ecosystem
    • ETFs in Canada
  • Tools
    • ETF Screener
    • ETF Country Exposure Tool
    • ETF Sector Tracker Tool
    • ETF Database Categories
    • Head-To-Head ETF Comparison Tool
    • ETF Stock Exposure Tool
    • ETF Issuer Fund Flows
    • Indexes
    • Mutual Fund To ETF Converter
  • Research
    • ETF Education
    • Equity Investing
    • Dividend ETFs
    • Leveraged ETFs
    • Inverse ETFs
    • Index Education
    • Index Insights
    • Top ETF Sectors
    • Top ETF Issuers
    • Top ETF Industries
  • Webcasts
  • Themes
    • AI ETFs
    • Blockchain ETFs
    • See all Thematic Investing ETF themes
    • ESG Investing
    • Marijuana ETFs
  • Multimedia
    • ETF 360 Video Series
    • ETF of the Week Podcast
    • ETF Prime Podcast
    • Video
  • Company
    • About VettaFi
    • Get VettaFi’ed
  • PRO
    • Pro Content
    • Pro Tools
    • Advanced
    • FAQ
    • Pricing
    • Free Sign Up
    • Login
  1. Index Insights
  2. Making the Case for Midstream with the AMNA Index
Index Insights
Share

Making the Case for Midstream with the AMNA Index

Stacey Morris, CFAJul 20, 2020
2020-07-20

Summary //

  • In response to shifts in the midstream universe, Alerian launched the Alerian Midstream Energy Index (AMNA) in June 2018 to provide a sector benchmark for investors and industry stakeholders primarily concerned with representation.
  • AMNA provides broad exposure to midstream MLPs and corporations headquartered in the US and Canada with a 10% cap on individual names but no limitations on MLP exposure.
  • AMNA exemplifies the benefits of a midstream allocation, including attractive income, more defensive energy exposure, real asset exposure, diversification, and an attractive free cash flow profile.

Several years ago, Master Limited Partnerships (MLPs) dominated the midstream universe, making MLP-only indexes a decent proxy for midstream broadly. Today, MLPs represent less than 40% of the North American midstream universe by market capitalization. An MLP-only index is ideal for benchmarking MLPs but is not sufficient for gauging North American midstream performance given the increased prevalence of US and Canadian corporations in the universe. In June 2018, Alerian launched the Alerian Midstream Energy Index (AMNA) to provide a sector benchmark for investors and industry stakeholders primarily concerned with representation. This piece discusses the superior representation of the AMNA Index and examines the benefits of an energy infrastructure allocation as exemplified by the index. Today’s note is a shortened version of a white paper published today, AMNA: The Benchmark Index for North American Midstream.

The evolution of the midstream landscape required a new benchmark.
In years past, the Alerian MLP Index (AMZ) was used to measure MLP performance and broader midstream given the prevalence of MLPs. However, MLPs have represented less than 50% of the midstream universe by market capitalization for a few years. MLP consolidations by parents structured as corporations, take-private deals, and other simplification transactions have driven this transition (read more). While the first notable consolidation came from Kinder Morgan (KMI) in 2014, the simplification trend accelerated in 2018 and 2019 for a variety of reasons. As illustrated in the chart, the makeup of the North American midstream universe has changed significantly over the last few years, with the share of MLPs declining and the total number of companies falling by roughly a third since 2015.

This is the image alt text

AMNA provides broad midstream representation.
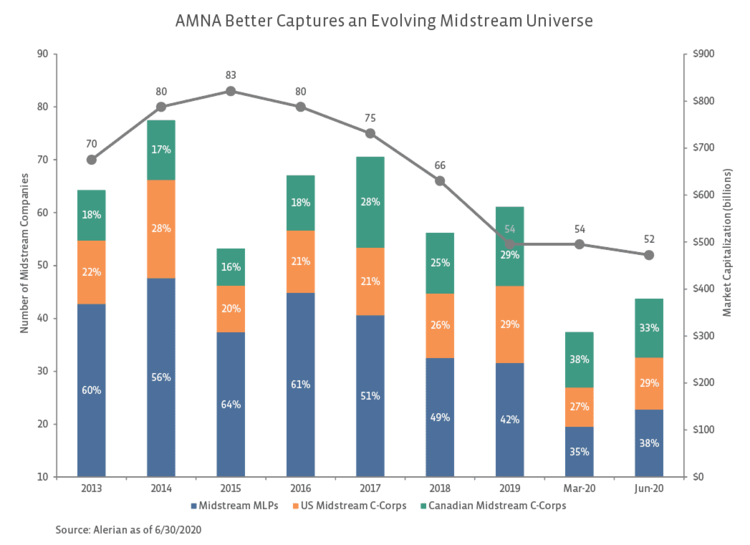
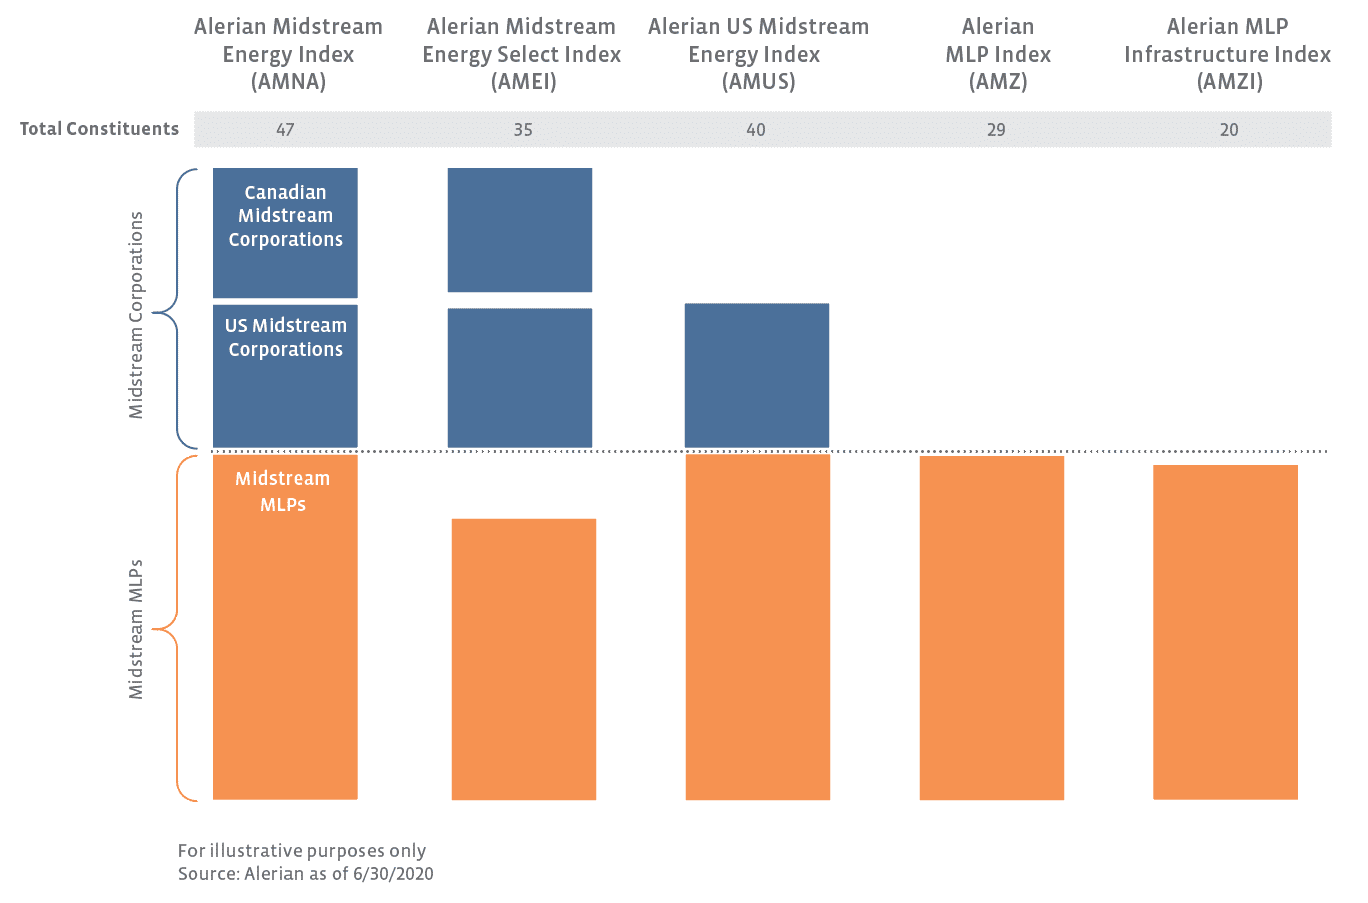
With the shift in the makeup of the midstream universe, the Alerian Midstream Energy Index (AMNA) was launched in June 2018 to provide superior sector representation, as shown below. (For an explanation of Alerian’s different indexes, please see this note.) The AMNA index includes MLPs as well as midstream corporations with principal offices in the US and Canada and has a modest liquidity requirement. Constituents must earn the majority of cash flows from midstream activities, which include Gathering & Processing, Liquefaction, Pipeline Transportation, Rail Terminaling, and Storage. As of June 30, 2020, AMNA had 47 constituents compared to 52 total companies in the universe. The index is weighted by float-adjusted market capitalization with a 10% cap.


Content continues below advertisement

This is the image alt text

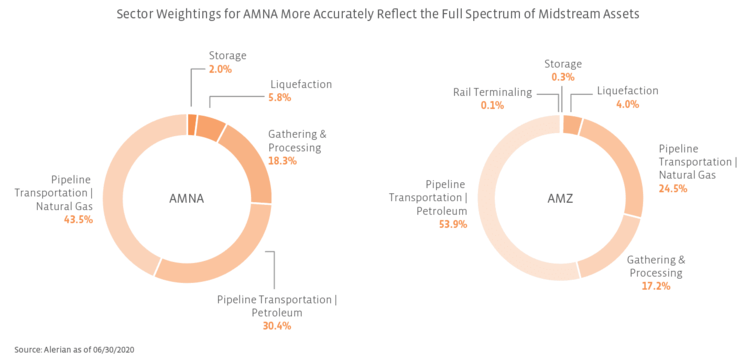
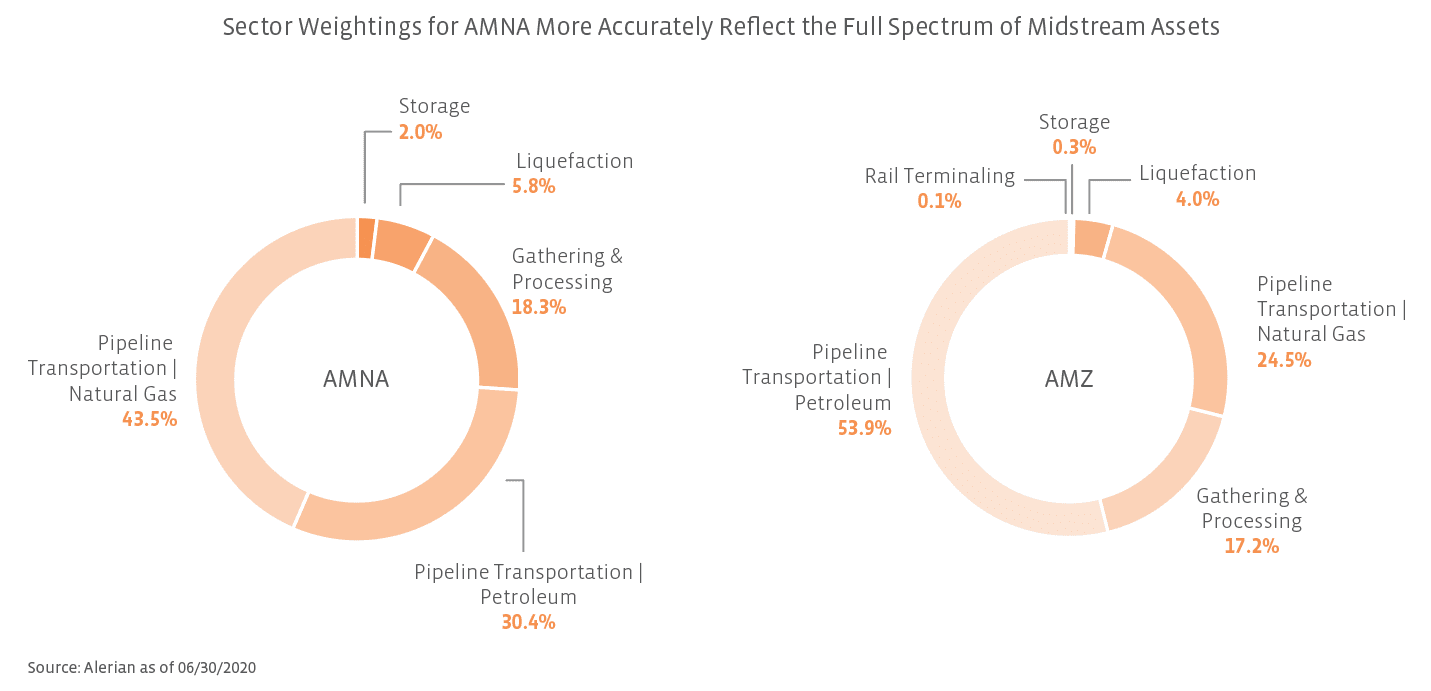
While there is a 10% cap on individual constituents, the AMNA Index does not have limitations on the portion of the index allocated to MLPs. This differentiates AMNA and its US subset, the Alerian US Midstream Energy Index (AMUS), from other Alerian indexes. If an investment vehicle such as a mutual fund or exchange-traded fund owns more than 25% MLPs, the fund will be taxed as a corporation (read more). Given these tax guidelines, benchmark indexes intended for these RIC-compliant funds limited MLP exposure at the cost of more accurate sector representation. AMNA also provides more comprehensive exposure to the full spectrum of midstream assets. MLP-only indexes tend to be lacking in exposure to interstate natural gas pipelines and have a greater exposure to companies involved in the pipeline transportation of petroleum, as shown in the comparison of sector weightings for AMNA and AMZ below.

This is the image alt text

Canadian midstream companies should not be overlooked.
The US and Canadian energy markets have become increasingly intertwined. Canada is the biggest provider of energy imports to the US, and Canada is the second-largest customer for US energy exports after Mexico. In addition to market integration, there is also significant cross border asset ownership by Canadian and US midstream companies. Furthermore, after the severe volatility to start this year, Canadian corporations accounted for the greatest share of the universe at the end of March 2020 (read more). While MLPs have since overtaken Canadian corporations in terms of market cap share, Enbridge (ENB) and TC Energy (TRP) are the largest midstream companies by market cap. Clearly, Canadian midstream corporations should not be overlooked. However, for those investors limited to owning US companies, the Alerian US Midstream Energy Index (AMUS) would be a more relevant benchmark.

AMNA exemplifies the benefits of an allocation to midstream.
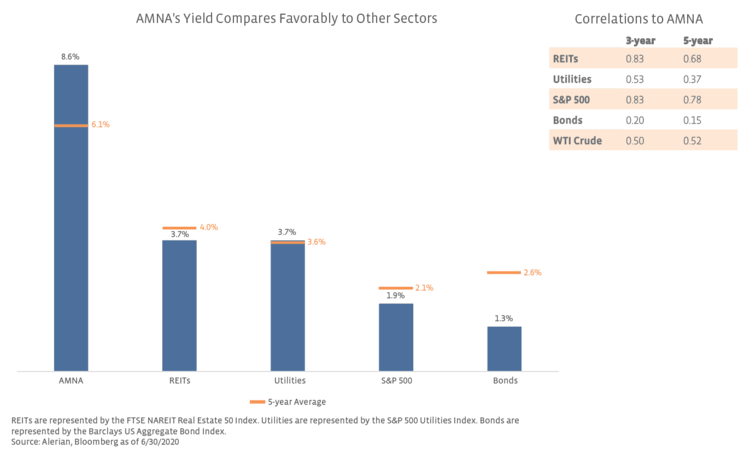
Given its broad representation, the AMNA Index can be useful for evaluating the benefits of a diversified allocation to energy infrastructure. Investors have historically been drawn to midstream for generous income with yields exceeding those of other income-oriented investments, as shown below. Despite elevated yields relative to history given macro headwinds (read more), it is important to note that companies with investment-grade credit ratings represented 83.0% of the AMNA index by weighting as of June 30, 2020. Additional benefits of an energy infrastructure allocation include real asset exposure, more defensive energy exposure given the fee-based nature of the midstream business model, and diversification. An allocation to midstream can enhance an income portfolio by increasing yield while further diversifying the portfolio given modest correlations with utilities and bonds, as shown below. Additionally, MLPs are not included in broader market indexes, which can provide another element of diversification.

This is the image alt text

As the midstream universe has evolved, there have also been a number of positive changes at the company level across the space in recent years. Midstream has reduced its dependence on equity capital markets and shifted towards self-funding equity growth capital. The vast majority of MLPs have eliminated incentive distribution rights from their structures, simplifying their businesses, lowering their cost of capital, and improving corporate governance. The energy infrastructure space has also taken steps to improve Environment, Social and Governance (ESG) reporting, with several companies providing annual sustainability reports (read more).

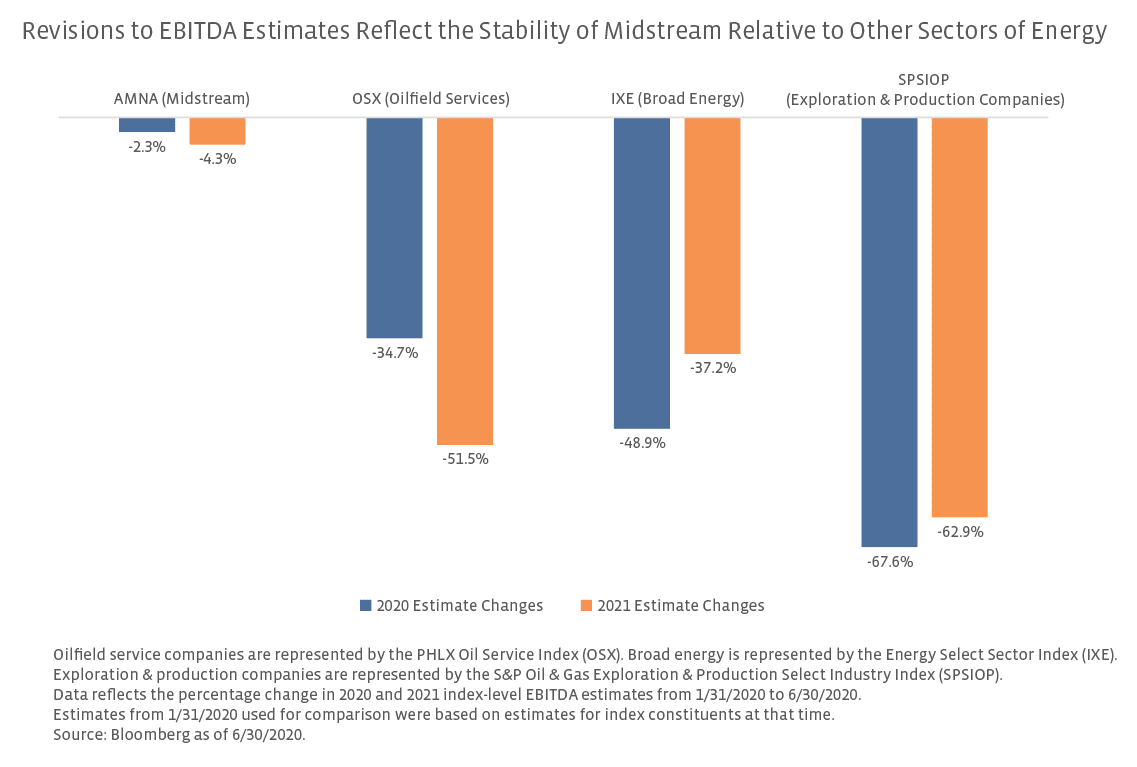
Despite macro headwinds today related to COVID-19, North American midstream companies are well positioned to withstand market volatility. Companies have responded by prioritizing financial flexibility, which has led to widespread reductions in growth capital spending plans and dividend cuts for smaller names. Specifically for AMNA, 20 of 48 constituents as of April cut their payouts for 1Q20, but this represented only 10.3% of the index by weighting as of April 17. While dividend cuts are frustrating for investors, they leave the space better positioned to weather current challenges. Furthermore, the fee-based nature of midstream insulates the sector’s cash flows from commodity price volatility, particularly relative to other sectors of energy as shown in the chart below.

This is the image alt text

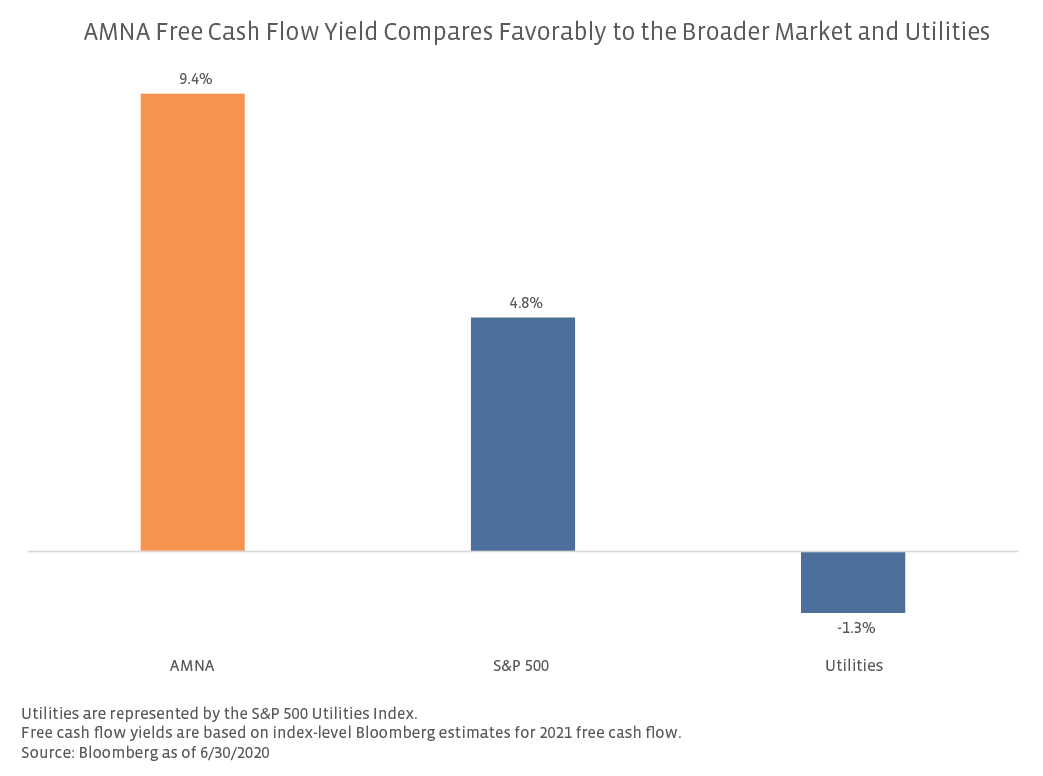
Entering 2020, the midstream space was nearing a free cash flow inflection point as growth capital spending was moderating from peak levels in recent years. Several companies had free cash flow generation after dividends in their sights for 2020 or 2021 (read more). Despite current macro challenges, midstream has the potential to generate meaningful free cash flow in the coming years, as shown in the chart below. In the near term, excess cash flow will likely be used to reduce leverage and shore up financial positioning. However, as demand recovers and energy markets stabilize, midstream could be well positioned to direct excess cash flow to shareholder-friendly returns, including buybacks and dividend increases.

This is the image alt text

Conclusion
Changes in the midstream landscape have necessitated a more comprehensive benchmark with MLPs and corporations. The Alerian Midstream Energy Index (AMNA) fulfills stakeholders’ needs for a representative sector benchmark for the North American midstream universe.

» Popular Pages

  • Tickers
  • Articles

Sep 29

A Fixed Income Primer for Constructing Portfolios

Sep 29

Main Management Market Note: September 29, 2023

Sep 29

Higher for Much Longer?

Sep 29

Moving Averages: S&P Ends September Down 4.9%

Sep 29

This Week in ETFs: FormulaFolios Renamed & Adds New Funds

Sep 29

Play Online Car Sales News in These 2 China ETFs

Sep 29

SEC Opens Ethereum Futures ETF Floodgates

Sep 29

VettaFi Voices On: Managing Risk in an Uncertain Economy

Sep 29

SPYI Outperforms SPY in Challenging 3rd Quarter

Sep 29

More Rate Hikes? Watch Treasury ETF USFR

QQQ

Invesco QQQ Trust Series I

SPY

SPDR S&P 500 ETF Trust

VOO

Vanguard S&P 500 ETF

JEPI

JPMorgan Equity Premium...

TLT

iShares 20+ Year Treasury...

SCHD

Schwab US Dividend Equity ETF...

SMH

VanEck Semiconductor ETF

VGT

Vanguard Information...

VTI

Vanguard Total Stock Market...

XLK

Technology Select Sector SPDR...

Loading Articles...
Our Sites
  • VettaFi
  • Advisor Perspectives
  • ETF Trends
Tools
  • ETF Screener
  • Mutual Fund to ETF Converter
  • Head-To-Head ETF Comparison
  • ETF Country Exposure Tool
  • ETF Stock Exposure Tool
  • ETF Database Pro
More Tools
  • Financial Advisor & RIA Center
Explore ETFs
  • ETF News
  • ETF Category Reports
  • Premium Articles
  • Alphabetical Listing of ETFs
  • Browse ETFs by ETF Database Category
  • Browse ETFs by Index
  • Browse ETFs by Issuer
  • Compare ETFs
Information
  • Contact Us
  • Terms of Use and Privacy Policy
  • © 2023 VettaFi LLC. All rights reserved.

Advertisement

Is Your Portfolio Positioned With Enough Global Exposure?

ETF Education Channel

How to Allocate Commodities in Portfolios

Tom LydonApr 26, 2022
2022-04-26

A long-running debate in asset allocation circles is how much of a portfolio an investor should...

Core Strategies Channel

Why ETFs Experience Limit Up/Down Protections

Karrie GordonMay 13, 2022
2022-05-13

In a digital age where information moves in milliseconds and millions of participants can transact...

}
X