

C-Corps significantly outperform MLPs in 2019 thanks to Canadian names.
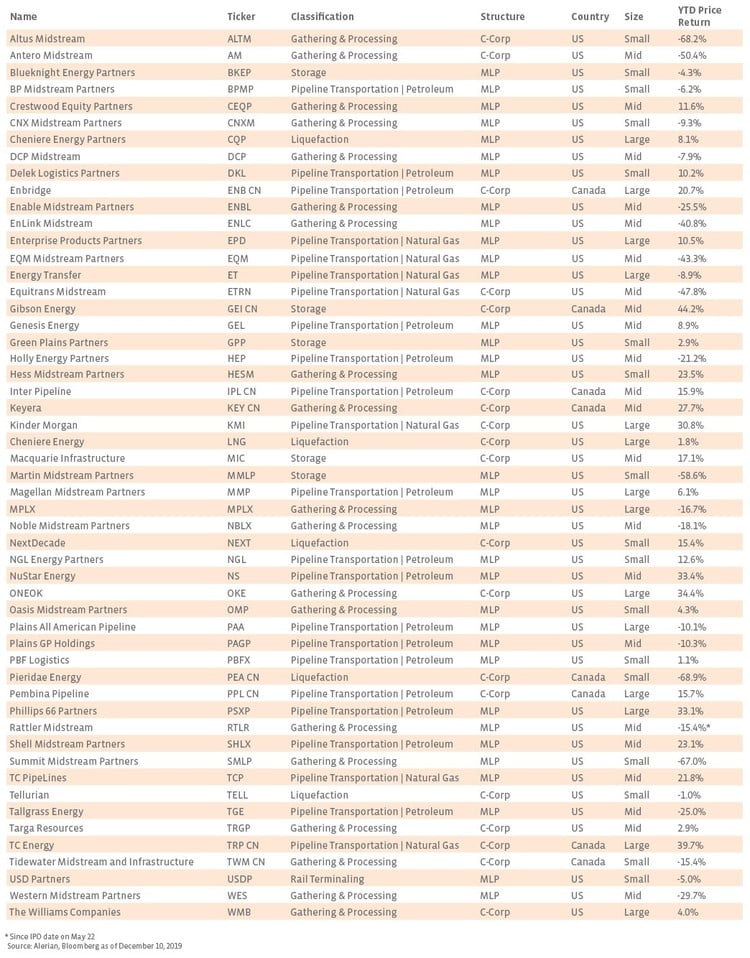
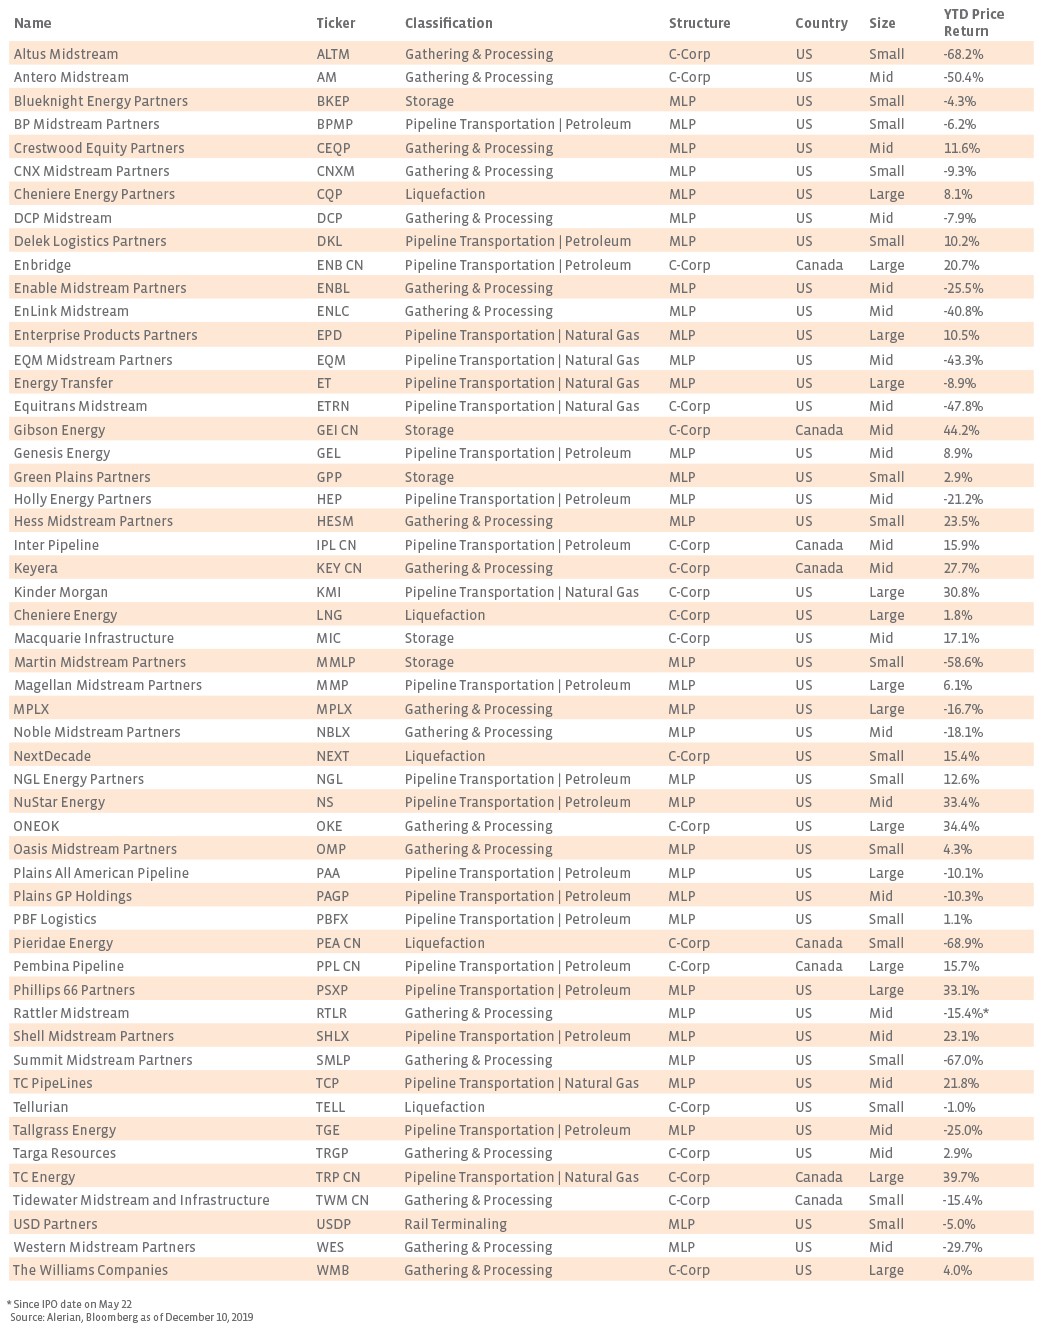
The performance of midstream in 2019 becomes more interesting when analyzed across various characteristics, including structure, geography, and size. In our analysis of the space, we used the constituents of the AMNA Index, which represents the North American midstream energy universe. The AMNA Index is comprised of 36.4% MLPs by weighting and 63.6% C-Corps, including 34.3% US C-Corps and 29.4% Canadian C-Corps as of the December 4 special rebalancing. Note that both the AMNA and AMZ Index are weighted based on float-adjusted market capitalization, so average performance reported by subgroup may not exactly align with index performance given the weightings. In addition, Kinder Morgan Canada was excluded as a result of its recent acquisition by Pembina Pipeline (PPL CN), while Sanchez Midstream Partners (SNMP) and Southcross Energy Partners (SXEEQ) were excluded as outliers. Rattler Midstream’s (RTLR) year-to-date performance is included from its IPO date on May 22, 2019.
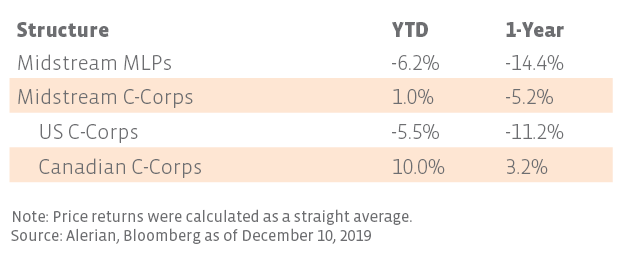
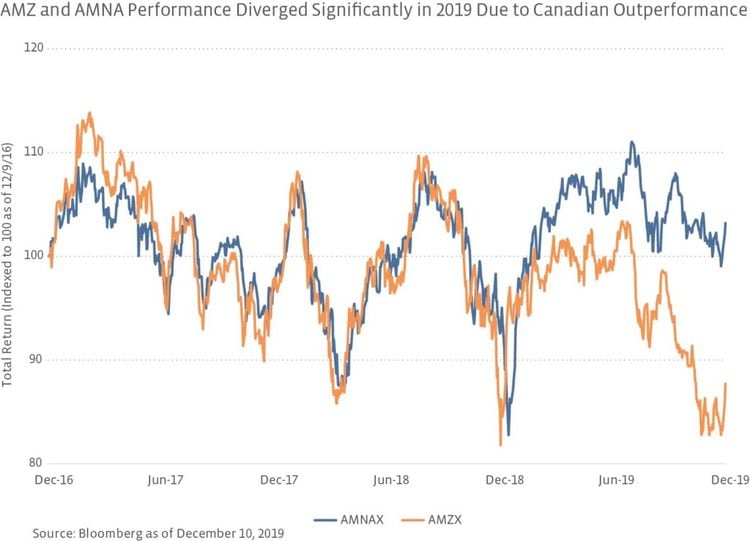
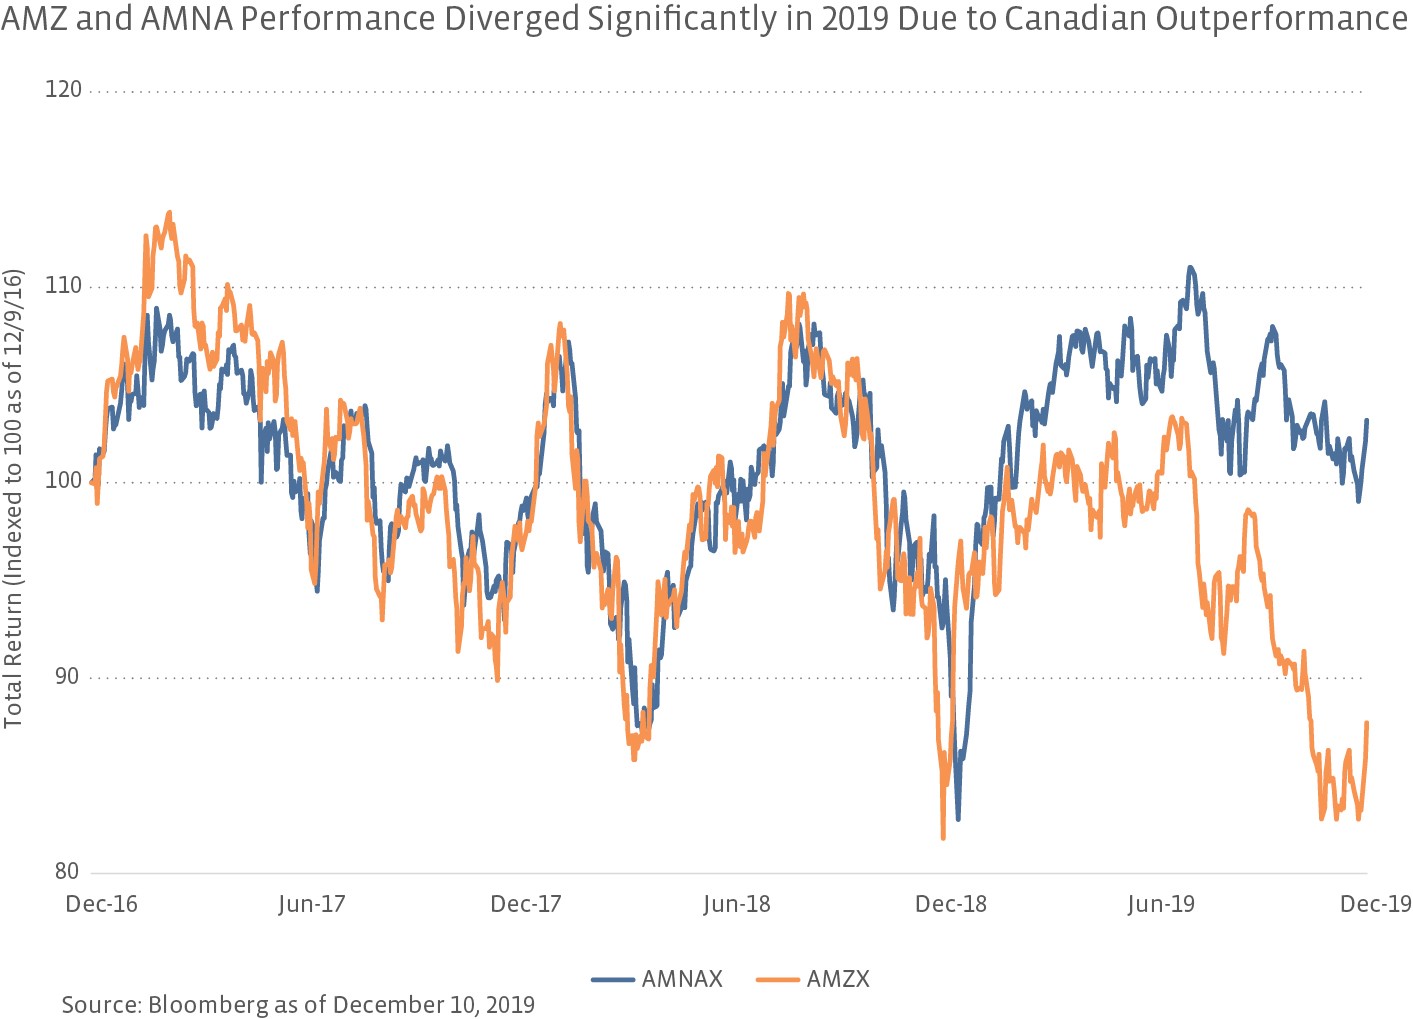
As shown in the table below, midstream C-Corps have significantly outperformed midstream MLPs in 2019 on a price-return basis, returning 1.0% against -6.2% for MLPs. However, when comparing US C-Corps to MLPs, the year-to-date performance difference is less than 100 basis points. Looking at the last three years, the spread between AMZ and AMNA total returns was consistently tight before diverging significantly this year on the strength of Canadian C-Corps (see chart).
What could be driving the difference in MLP and C-Corp performance aside from Canadian C-Corp strength? The AMZ Index has a higher weighting of underperforming Gathering and Processing names at nearly 30% as of the September quarterly rebalancing compared to 25.7% for the AMNA Index as of the December 4 special rebalancing. The average market cap of AMNA is also larger, which can impact performance since larger companies are more diversified and better positioned to withstand commodity price volatility. In contrast to MLPs, midstream corporations are also more likely to reap the benefits of wider access to capital and passive funds through inclusion in broad equity indexes. MLPs are generally excluded because of their structure, but if they convert to a C-Corp, size may limit broader market index inclusion depending on the MLP. Another issue has been investor skepticism about MLP governance and the MLP structure. MLPs have taken steps recently to alleviate governance concerns by eliminating incentive distribution rights (IDRs), increasing board voting rights to unitholders, and disclosing more generalist-friendly metrics. As many have been stating publicly, MLP management teams will likely continue to evaluate the benefits of the MLP tax advantage against the potential for a broader investor base and will want to see if C-Corp outperformance continues over a longer period. Furthermore, the pending 2020 election may be reason to keep management teams in a wait-and-see mode.
Large-Cap MLP outperformance reflects company-level improvements.
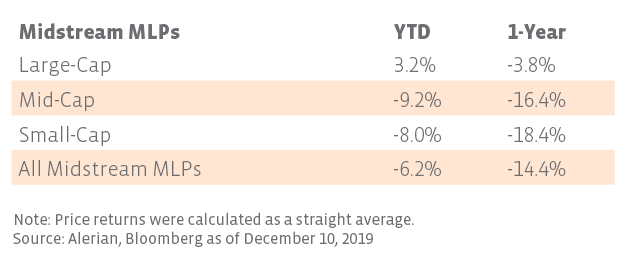
Analyzing MLP performance by market capitalization as of December 10 reveals a positive bias toward large partnerships. In breaking performance down by Large-Cap (>$10 billion), Mid-Cap ($2-10 billion), and Small-Cap (<$2 billion) MLPs, it becomes clear that Large-Cap MLPs have outperformed the rest of the group by returning 3.2% through December 10 (see table) compared to year-to-date losses for small- and mid-cap MLPs. Larger MLPs (including some Mid-Cap MLPs) have put in place many of the desired improvements requested by investors over the last few years, such as reduced leverage, equity self-funding, and elimination of IDRs. Many of these MLPs also benefit from a diversified mix of assets across different basins, which can provide additional defensiveness during volatile commodity price environments.
Large-Cap C-Corps, Canadian names lead midstream performance in 2019.
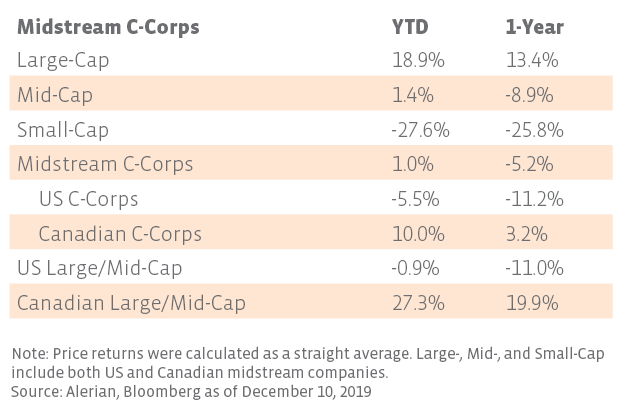
One of the true bright spots in energy this year has been midstream corporations. Similar to MLPs, Large-Cap C-Corps outperformed smaller companies with a 18.9% price return to date (see table). From a geographic perspective, US companies of all sizes underperformed Canadian midstream companies, which are up 10.0% this year. Combining geography and size, Canadian Large- and Mid-Cap companies are up over 27% through December 10, well ahead of US Large- and Mid-Cap companies, which are down 0.9%. Canadian companies have demonstrated defensiveness during periods of commodity price volatility and hold a lower correlation with the S&P 500 and crude than US midstream companies. Canadian midstream is even more concentrated than US midstream, with only six companies having a market cap of over $1 billion.
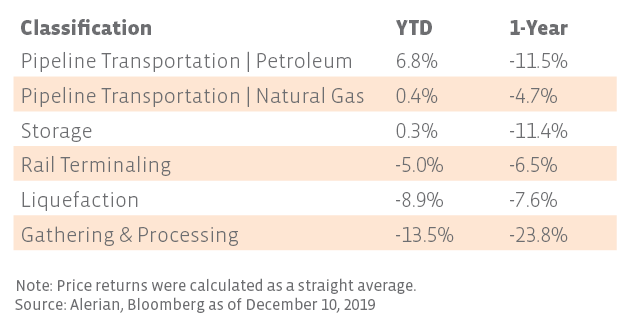
Gathering and Processing segment has been hit hardest YTD.
Another way of viewing performance is through midstream business classification. Using Alerian’s Energy Midstream Classification Standard (EMCS), each company was grouped according to its primary business activity. Under the standard, the pipeline businesses are separated out by long-haul transporters of crude and natural gas versus companies that primarily focus on gathering and processing hydrocarbons. As shown in the table below, Pipeline Transportation | Petroleum, comprised of companies focusing on long-haul crude pipelines, has been the strongest segment this year at a 6.8% price return followed by Pipeline Transportation | Natural Gas and Storage. The Gathering and Processing (G&P) segment has been a notable underperformer, dropping 13.5% so far this year. Slowing production growth, particularly for US natural gas, weighed more heavily on the midstream names operating closest to the wellhead and those exposed to a single main producer (Read More). Companies classified as Gathering and Processing make up approximately 25.7% of the total weight of the AMNA index. Rail Terminaling and Liquefaction have also been negative but are comprised of a smaller number of companies.
Bottom Line
After a solid start to 2019 for midstream, many in the industry are likely ready to turn the calendar to 2020 after a tough second half of the year. Midstream MLPs have underperformed C-Corps, but structure alone does not tell the whole story – returns have been better for large companies over small and for Canadian names over US names. Gathering and Processing companies underperformed other business segments as a result of slowing US natural gas production growth. Company-level improvements have helped midstream companies withstand headwinds this year, and continued progress on this front is likely to benefit performance going forward.
Appendix

