

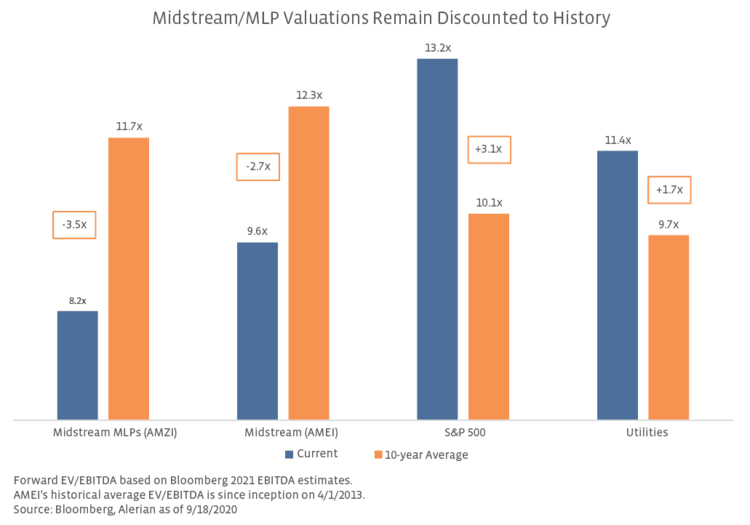
The combination of pressured equity performance and resilient EBITDA estimates has resulted in sizable discounts for forward EV/EBITDA multiples for midstream. The chart below compares current valuations for midstream, MLPs, the S&P 500, and utilities with their ten-year averages. Note that the Alerian Midstream Energy Select Index (AMEI), an investable subset of AMNA, was used in this analysis given more historical data. AMEI and AMZI are both trading approximately 3 turns below their respective long-term average and also trading below the lows from early 2016 when WTI crude prices were in the high $20s per barrel (read more). While changes over time impact the comparability of current and historical valuation metrics (read more), the gap between those multiples today is striking, especially in contrast to the S&P 500 and utilities trading multiple turns above historical averages. With many assets at or near all-time highs and certainly at premiums relative to history, midstream’s discounted valuations stand out.

Slicing and dicing midstream multiples.
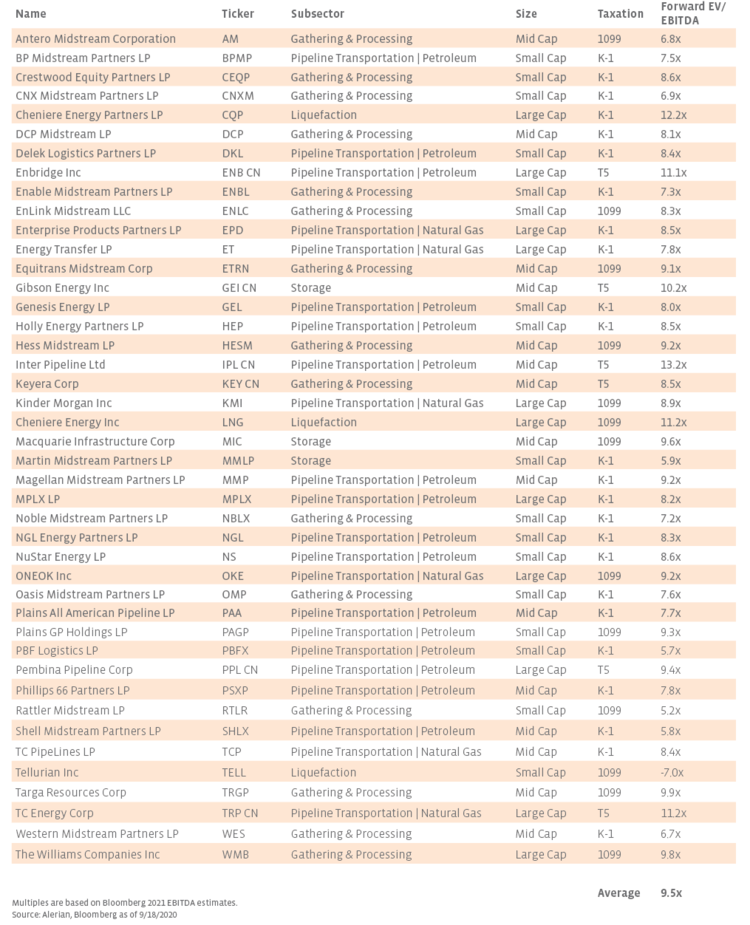
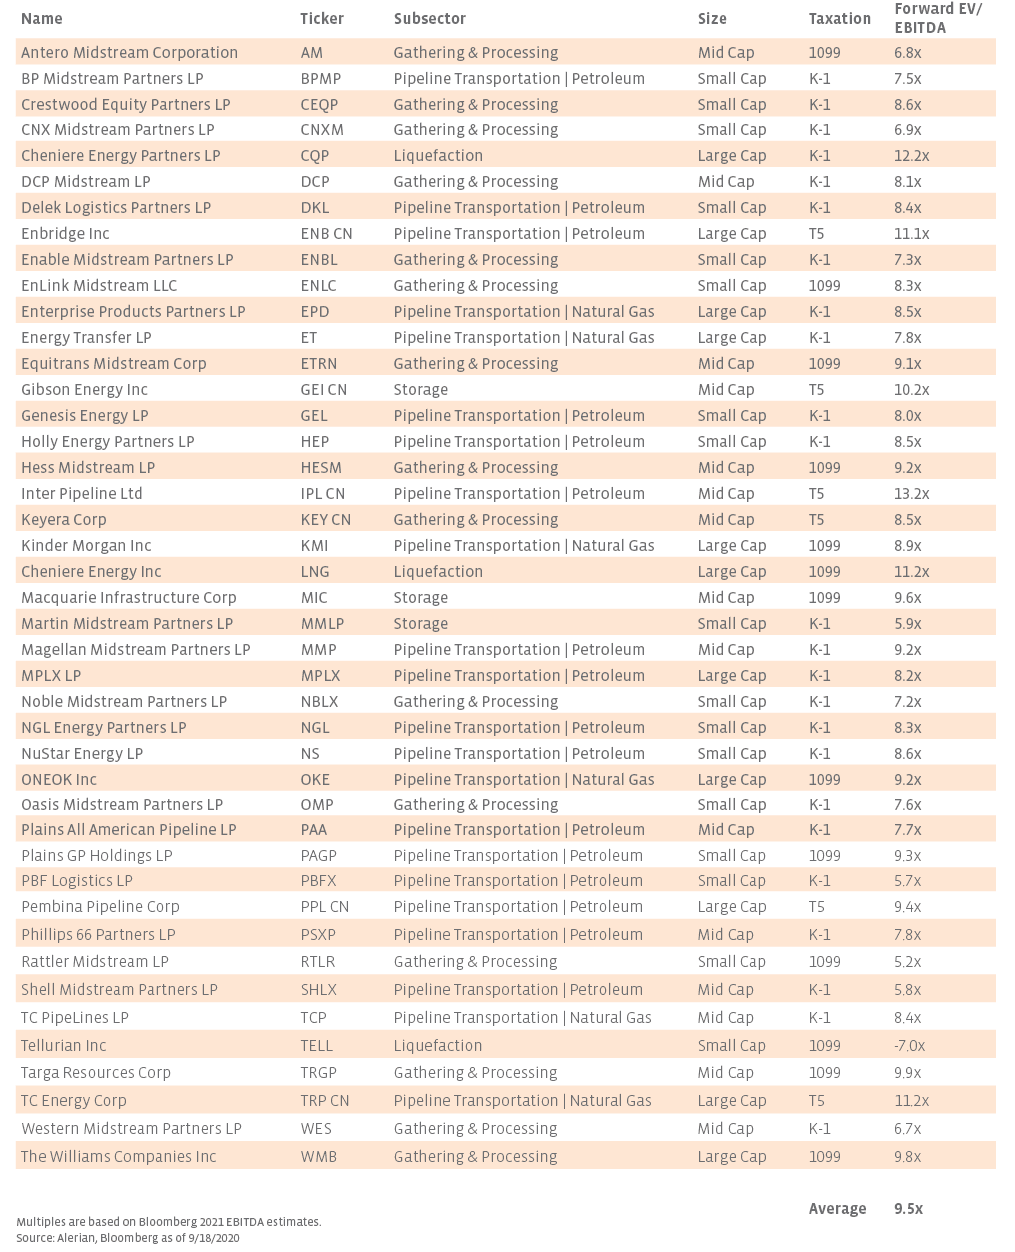
While a broad examination of midstream valuation multiples is helpful for contextualizing the industry as a whole, a deeper look at how operations, asset base, size, and corporate structure impact valuations can help investors better understand the space. Admittedly, a number of variables impact valuations, and an analysis of one parameter will be impacted by others. The remainder of this piece serves as an examination of forward EV/EBITDA multiples for midstream using the constituents of AMNA. For a detailed breakdown of current forward EV/EBITDA valuations for all AMNA constituents, please see the table in the appendix.
Subsectors: natural gas pipelines garner a premium.
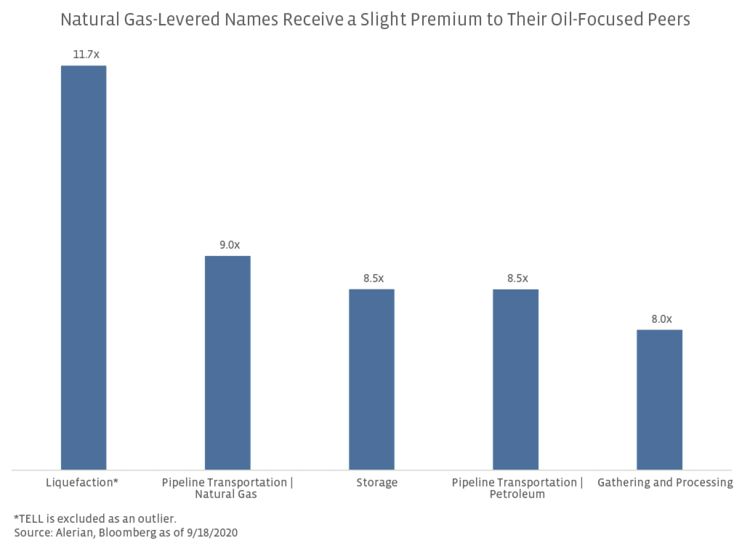
A midstream company’s asset base (think geography/basin exposure, type of hydrocarbon) can have a notable impact on valuations, particularly when it comes to their primary operations. The chart below shows the equally-weighted average EV/EBITDA multiple for companies in each of the five subsectors of AMNA: Natural Gas Pipeline Transportation, Petroleum Pipeline Transportation, Gathering and Processing, Storage, and Liquefaction. Excluding liquefaction, which only includes Cheniere Energy (LNG) and Cheniere Energy Partners (CQP), natural gas pipeline transportation companies have the highest average multiple currently at 9.0×. Despite trading at a premium to some of their midstream peers, natural gas transportation names currently trade below the implied 10.0x multiple for Warren Buffet’s purchase of Dominion Energy’s (D) gas transmission and storage infrastructure announced in July (read more).
Relative to oil, natural gas and natural gas liquids have been a bright spot in energy (read more). Additionally, many long-haul natural gas pipelines are demand-pull pipelines, which provide gas to power plants, utilities, industrial plants, or liquefied natural gas facilities and benefit from ongoing consumption from those customers (read more). By weighting, natural gas transportation represents the largest portion of AMNA at 42.0% as of September 18. On the opposite end of the spectrum, gathering and processing (G&P) names have the lowest average EV/EBITDA multiples. G&P tends to have the most sensitivity to commodity prices given proximity to the wellhead and dependence on upstream activity for growth as supply-push pipelines. G&P companies can also have potential commodity price exposure in some processing contracts.

Market capitalization: bigger is better for midstream valuations.
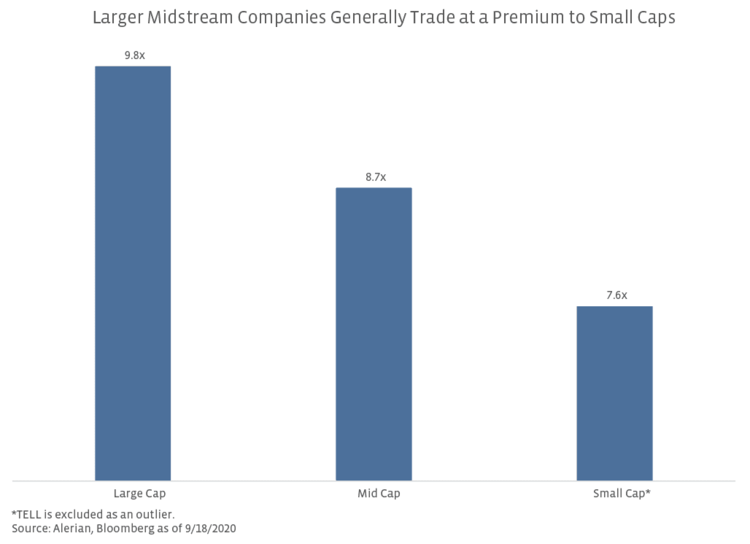
Market capitalization also tends to play a part in valuations, with larger names generally trading at a premium to their smaller peers. For the purposes of this analysis, large caps include companies with a market capitalization of over $10 billion, small caps have a market capitalization of less than $2 billion, and mid cap names fall in between the two groups. Putting all the constituents of AMNA in these categories, large cap midstream names trade 2.2x higher than small caps on average. Larger names typically have a broader asset base across geographies and hydrocarbons, as well as diversified and high-quality customers. These companies have also traditionally had a better dividend track record, as demonstrated during 1Q20 dividend announcements (read more). By contrast, smaller names tend to offer less business and geographical diversification and often have a more concentrated customer base. While there are exceptions to these trends, size is clearly a factor in valuations.

Structure: Canadian corporations have an edge over US peers.
Corporate structure can also provide insight into multiples. MLPs are broadly trading at a discount to both US and Canadian C-Corporations. Admittedly, the equally-weighted averages shown in the chart below could be working to the advantage of C-Corps. Nineteen out of the twenty-four MLPs in AMNA are either G&P or petroleum pipeline transportation companies, which tend to garner lower multiples. C-Corporations are weighted more towards natural gas pipelines, which, as discussed earlier, trade at a premium. From a size perspective, there tend to be more small MLPs than small C-Corps, which can also impact the average. Though for context, the weighted average EV/EBITDA multiple of the all-MLP AMZI index is 8.2x (shown above). In addition to discrepancies in size and business activities, there are other potential reasons why US C-Corps trade at a higher multiple than MLPs. Corporations tend to offer superior governance (read more), and in some cases, may benefit from broader market index inclusion and related fund flows.
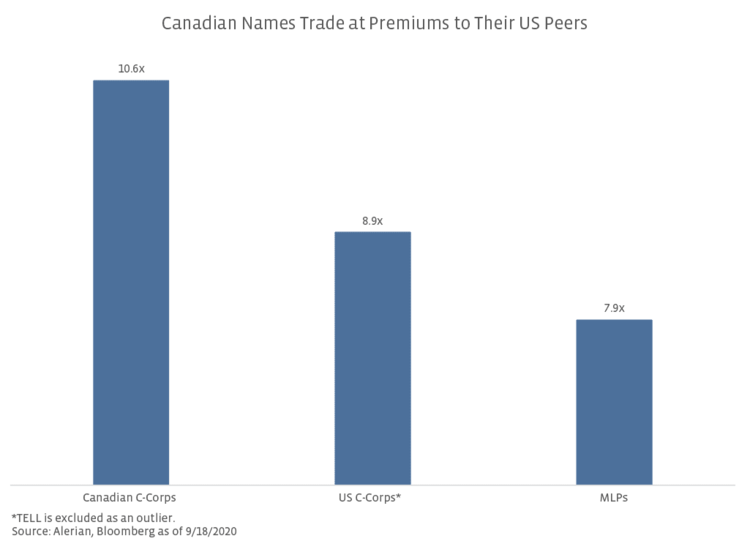

Within the C-Corp structure, Canadian companies enjoy premium multiples and have continued to perform defensively relative to their US peers. So far this year, the Canadian names within AMNA have declined by 24.4% on an equally-weighted basis compared to a 41.8% decline in the Alerian US Midstream Energy Index (AMUS). This outperformance could be attributed to the strength in their underlying businesses, low correlations to oil prices, constructive updates in the wake of COVID-19, and likely some rotation into Canadian names as energy markets became volatile. The defensiveness of Canadian names, complemented by solid dividend track records (read more), helps explain the resulting valuation premium.
Bottom Line
While midstream companies are trading at a discount to historical averages across the board and stand out in a market with valuations that are largely stretched by historical standards, today’s piece helps to further frame why certain types of companies within midstream command higher multiples relative to others. Size, asset base and proximity to the wellhead, structure, and geography can all factor into company’s multiples.
Appendix

