Summary
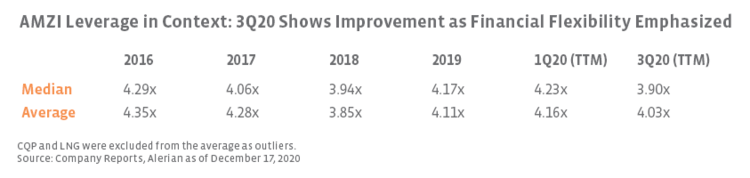
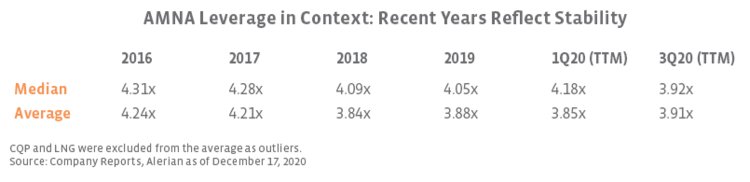
- The average leverage ratio for the AMZI dropped from 4.35x in 2016 to 4.03x in 3Q20 and from 4.24x to 3.91x for AMNA during the same period.
- Leverage has trended down in 2020 as company actions prioritizing financial discipline and resilient earnings drove balance sheet improvements.
- In addition to improving flexibility during volatile periods, reducing leverage is a prerequisite to shareholder-friendly returns of capital such as buybacks and will likely remain an area for continued progress for many names going forward.
The macro headwinds that have accompanied the COVID-19 pandemic have undoubtedly made 2020 a challenging year for midstream, though midstream has been better positioned for these challenges than other energy sectors that are more dependent on commodity prices. As midstream contended with significant market volatility that acted as a real-life stress test on businesses earlier this year, the sector’s financial positioning has been in focus. Today’s note examines how leverage metrics have evolved in the midstream space and discusses how leverage improvements have laid the groundwork for buybacks as means of returning excess cash to shareholders. Importantly, though investors and midstream companies alike have begun to optimistically look forward to a post-pandemic world, leverage is likely to remain a focus area for midstream.
Midstream positioning into 2020 helped insulate the space from macro headwinds.
From 2016 to the present, midstream company leverage ratios have come down broadly. The tables below show how leverage has eased since 2016 at the index level for both the MLPs of the Alerian MLP Infrastructure Index (AMZI) and the broader midstream universe represented by the Alerian Midstream Energy Index (AMNA). Leverage was calculated by dividing long-term debt by adjusted EBITDA on an annual basis from 2016 to 2019 and on a trailing twelve-month (TTM) basis for 1Q20 and 3Q20. Notably, average leverage has dropped from 4.35x in 2016 to 4.03x in 3Q20 for the AMZI and from 4.24x to 3.91x for AMNA during the same period. Looking solely at 2020, average leverage for the AMZI decreased from 4.23x as of the first quarter, an elevated level relative to prior years, to 3.90x as of 3Q20. For AMNA, average leverage was basically flat, increasing slightly from 3.85x in 1Q20 to 3.91x in 3Q20.
Following challenged oil prices from 2014 to 2016, many midstream companies placed more emphasis on reducing debt to improve financial flexibility. Unlike prior downturns, most midstream companies were thus better prepared to weather this year’s challenges given steps taken to reduce leverage, improve distribution coverage, and ease capital spending. In general, leverage rose broadly for the space earlier this year but has since moved closer to prior levels. In addition to resilient earnings due to fee-based business models, company actions prioritizing cost reductions and capital discipline have contributed to leverage improvements this year. Beyond these improvements, some companies are pursuing asset sales to accelerate deleveraging, but it has been difficult to solidify asset sale agreements in the current environment. As markets stabilize, the environment for asset sales may become more favorable in the coming months.
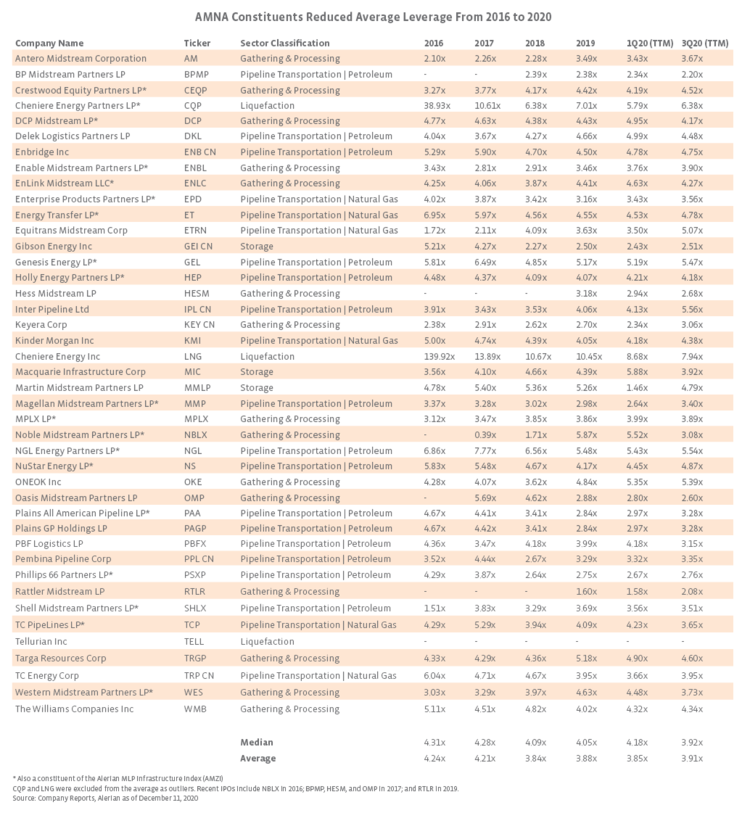
Leverage is best viewed at the individual company level.
While index-level leverage metrics provide a sense of how leverage is changing broadly, examining leverage at the company level can provide greater context. The table in the Appendix shows leverage metrics and sector classifications for the constituents of the AMNA Index. With 2020 presenting new challenges, the importance of balance sheet strength was fully realized and resulted in another push to reduce leverage for some names. This was especially true for some gathering and processing MLPs with greater commodity price exposure or more concentrated counterparty risk that entered 2020 in a weaker financial position in terms of leverage and distribution coverage. Of note, leverage was elevated for some of these names due to recent dropdown and simplification transactions resulting in higher debt levels. Positively, several of these MLPs took difficult but necessary steps to reduce leverage this year. Western Midstream Partners (WES), DCP Midstream (DCP), and EnLink Midstream (ENLC) each cut their distributions by 50% or more this year and used the extra cash to prioritize balance sheet improvements in conjunction with other cost cutting measures and reductions in capital spending. The leverage reductions for these MLPs have been notable as detailed in the Appendix.
In general, capital expenditures decreased significantly this year across midstream as many projects were deferred or canceled, but some companies saw their leverage ratios stay about the same or increase slightly as a result of continued spending on capital-intensive growth projects funded in part by debt. Equitrans Midstream’s (ETRN) leverage ratio increased as a result of its merger with EQM Midstream in June as well as ongoing construction of the Mountain Valley interstate natural gas pipeline, which has seen its estimated total cost creep up to $5.9 billion. Large Canadian corporations Enbridge (ENB CN) and TC Energy (TRP CN) have significant growth project backlogs that require higher levels of debt. Other midstream companies have made progress in lowering elevated leverage ratios but still have further to go. Reducing leverage will likely remain a priority for these companies.
Reducing leverage is a prerequisite for other means of capital return.
In addition to improving flexibility during volatile periods, reducing leverage is arguably a prerequisite to shareholder-friendly returns of capital. As midstream companies generate more free cash flow as spending falls, there will likely be greater opportunity to further reduce leverage, repurchase shares, or increase dividend payouts. With valuations remaining discounted relative to history, several companies have announced opportunistic buyback authorizations recently (read more), including notable leverage reducers Plains All American (PAA), ENLC, and WES, in conjunction with 3Q20 results. ENLC noted in the release that it continues to emphasize leverage reductions, but the partnership’s recent execution allows it to utilize unit repurchases as one way to generate returns for investors.
Bottom Line
Leverage metrics for midstream have broadly improved since 2016, marking a meaningful step in increasing financial flexibility and opening doors in terms of returning capital to shareholders in new ways through buybacks. Although midstream’s progress in reducing leverage to this point is encouraging, it is likely to remain an area for continued improvement for many names going forward.
AMZI is the underlying index for the Alerian MLP ETF (AMLP) and the ETRACS Alerian MLP Infrastructure Index ETN Series B (MLPB). AMNA is the underlying index for the ETRACS Alerian Midstream Energy Index ETN (AMNA).
Appendix