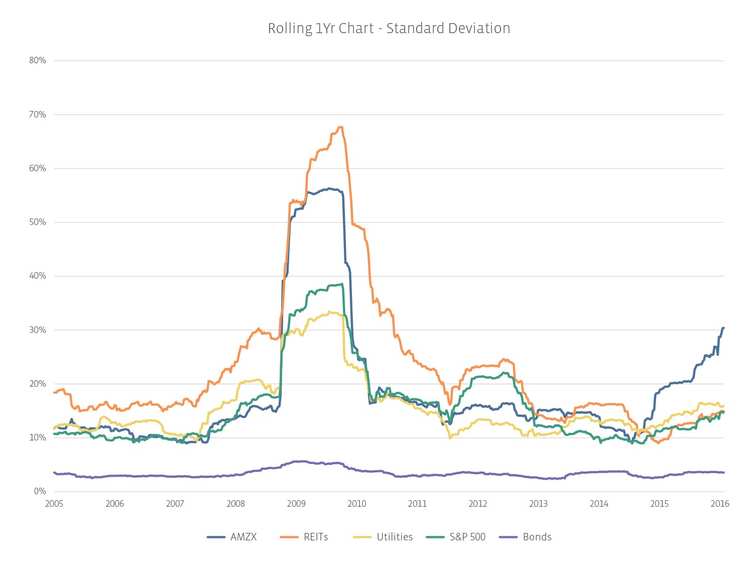
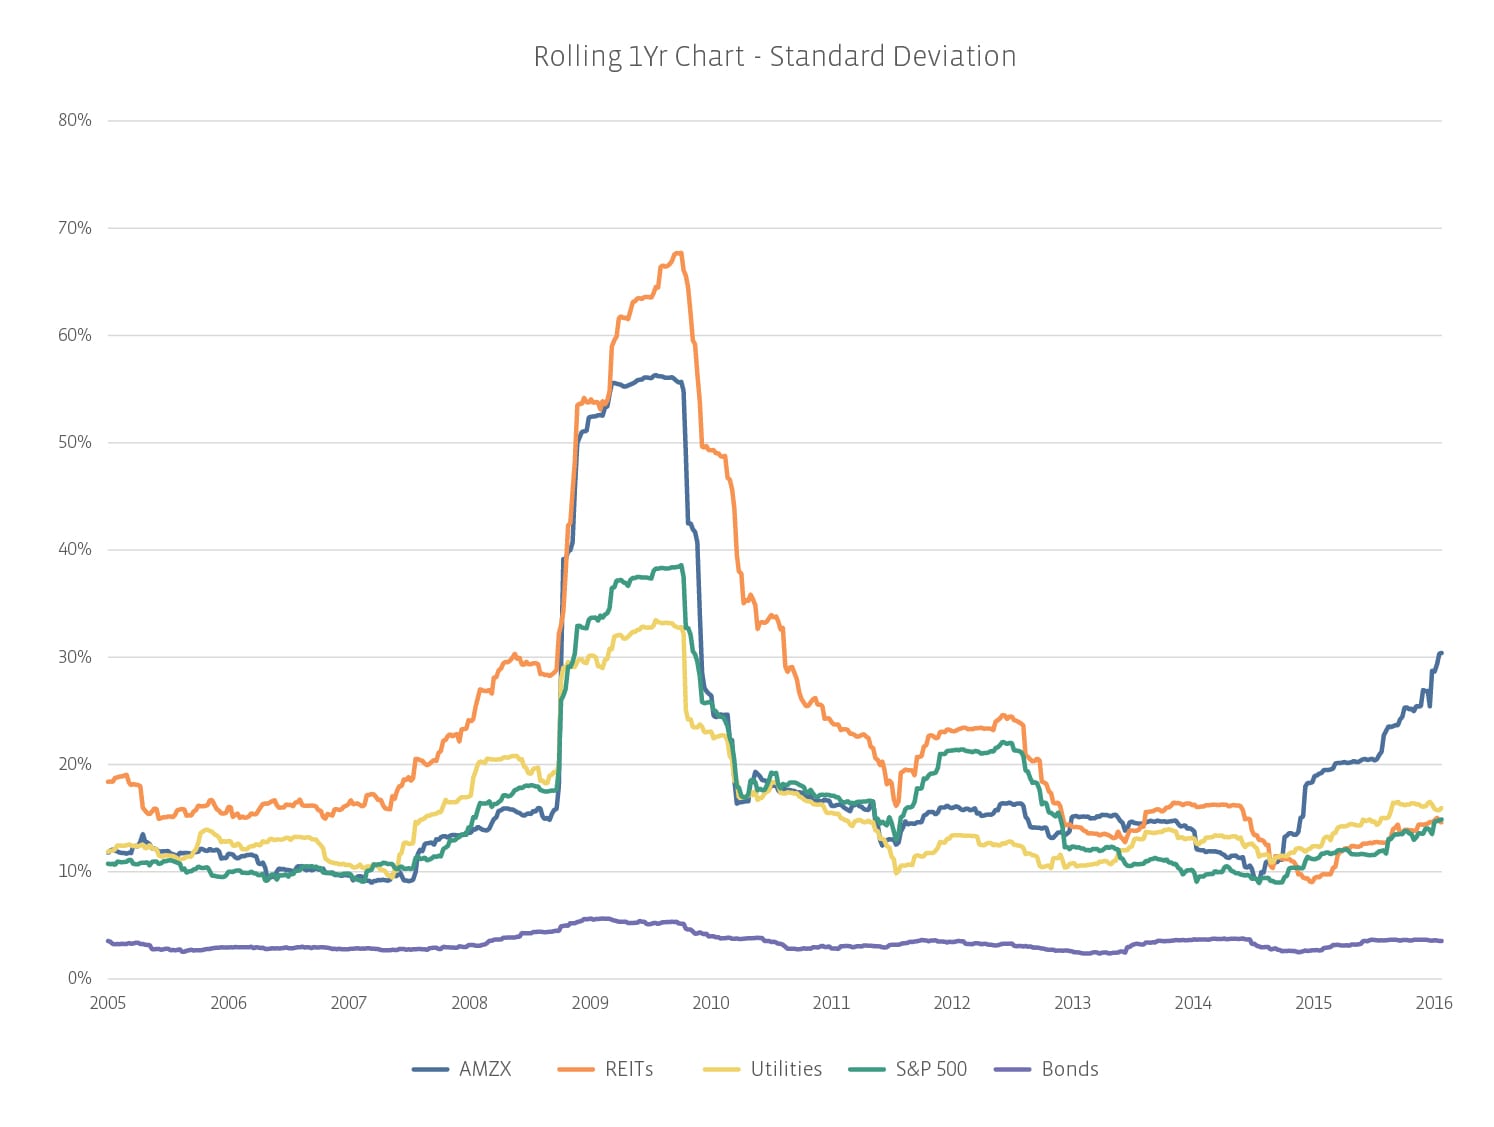
The chart above shows that volatility for other comparable asset classes was the same or worse during the financial crisis than it is for MLPs today. Since other asset classes are not exhibiting the same increase in volatility, it seems like MLP volatility is higher than ever, but the data actually shows that MLPs are merely more volatile than other asset classes. While it isn’t the end of the world, relative volatility has increased, albeit it’s not as bad as the financial crisis.
Think of it this way: what a seven year old considers to be a scary movie and what you consider to be a scary movie are very different. So, if your only concern is volatility and you worry that MLPs have never traded so wildly and, for this reason alone, you believe we’re at end of days, please rest assured: MLPs have seen this level of volatility before. However, it’s more than optics. Unlike during the financial crisis, when volatility suddenly spiked, stayed at that level, and then fell, MLP volatility has been gradually increasing over the past 18 months.
Volatility is a measure of uncertainty, or risk. The increasing volatility quantifies something MLP investors have intuitively realized: MLPs are risky investments. They will not and have never been appropriate bond substitutes.
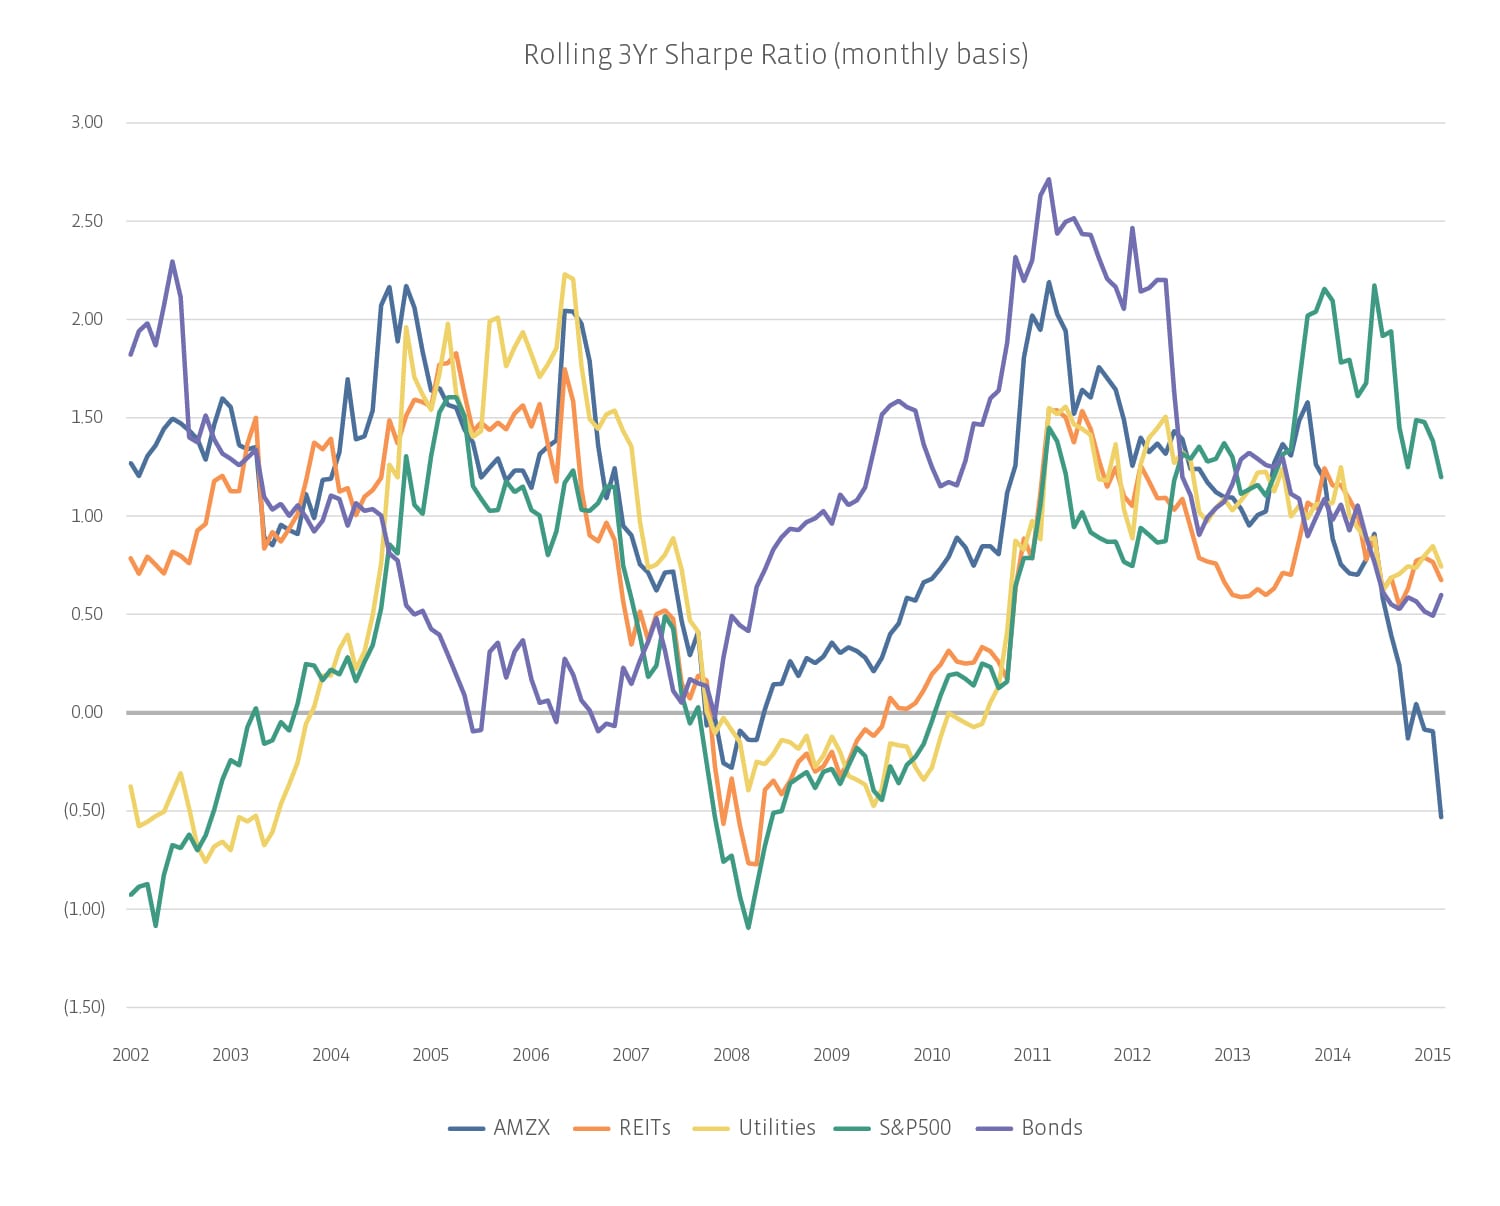
A rational investor wants increasing levels of reward to compensate for increasing levels of risk. Formally, this is measured with a Sharpe ratio, which quantifies reward per unit of risk. A Sharpe ratio of 1.0 is considered to be very good. A Sharpe ratio of 2.0 is so excellent that it is generally unsustainable and may imply over-valuation. A negative Sharpe ratio, on the other hand, means that an investment in Treasuries, over the same time period, would have produced superior risk-adjusted results.
[Caveat: Using an absolute Sharpe ratio in isolation should not be the single factor investors use when making decisions. The best use of Sharpe ratios is in comparing asset classes or funds within asset classes. The total amount of risk and volatility, as mentioned above, should also be considered. Equally, the time frame (daily, weekly, monthly) as well as the length of the data set should be kept in mind.]
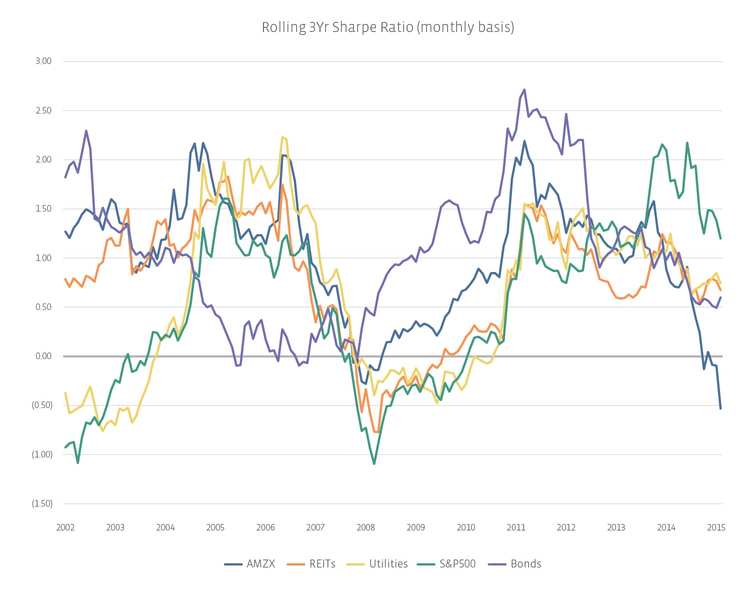
Over the past decade, Sharpe ratios have fluctuated for many asset classes. In the past year, many asset classes have seen a declining Sharpe ratio, but MLP Sharpe ratios have fallen the most in magnitude. Those investors with a long time horizon would be hard pressed to decide on a single asset class by examining this data. This is one of many reasons that most money managers recommend a diversified portfolio. By using diversification, investors without crystal balls can avoid putting all their eggs in one basket. Since the above chart makes it impossible to choose a single asset class based on historical data, a diversified portfolio can smooth returns.
Relative to MLPs, the mean/median/mode of Sharpe ratios for other asset classes has already been established, it remains to be seen at which level MLPs will correct. Many analysts agree that MLP Sharpe ratios will revert to the mean—it’s just difficult to know where the mean is. MLPs are still only about 30 years old, while other asset classes have been around for decades longer. Asset classes can be inefficient in the beginning as there are few market participants and many valuation inefficiencies, resulting in arbitrage opportunities. However, in the past ten years, MLPs have seen a large influx of new investors, particularly institutional investors, resulting in a decreased number and magnitude of high reward/low risk opportunities. This is all to say that the mean/median/mode for MLPs is still to be determined.
As an indexing firm, Alerian focuses on providing investors with accurate data and education so they can form their own opinions and make their own decisions. The explanation and data is provided above so that investors can judge for themselves whether an MLP allocation is right for their portfolios in 2016.

