
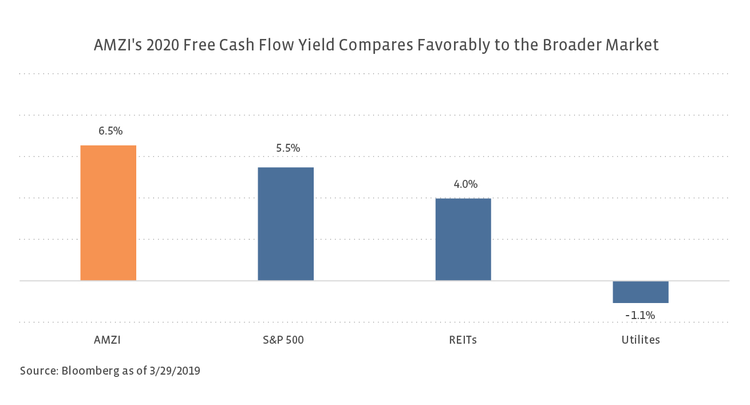
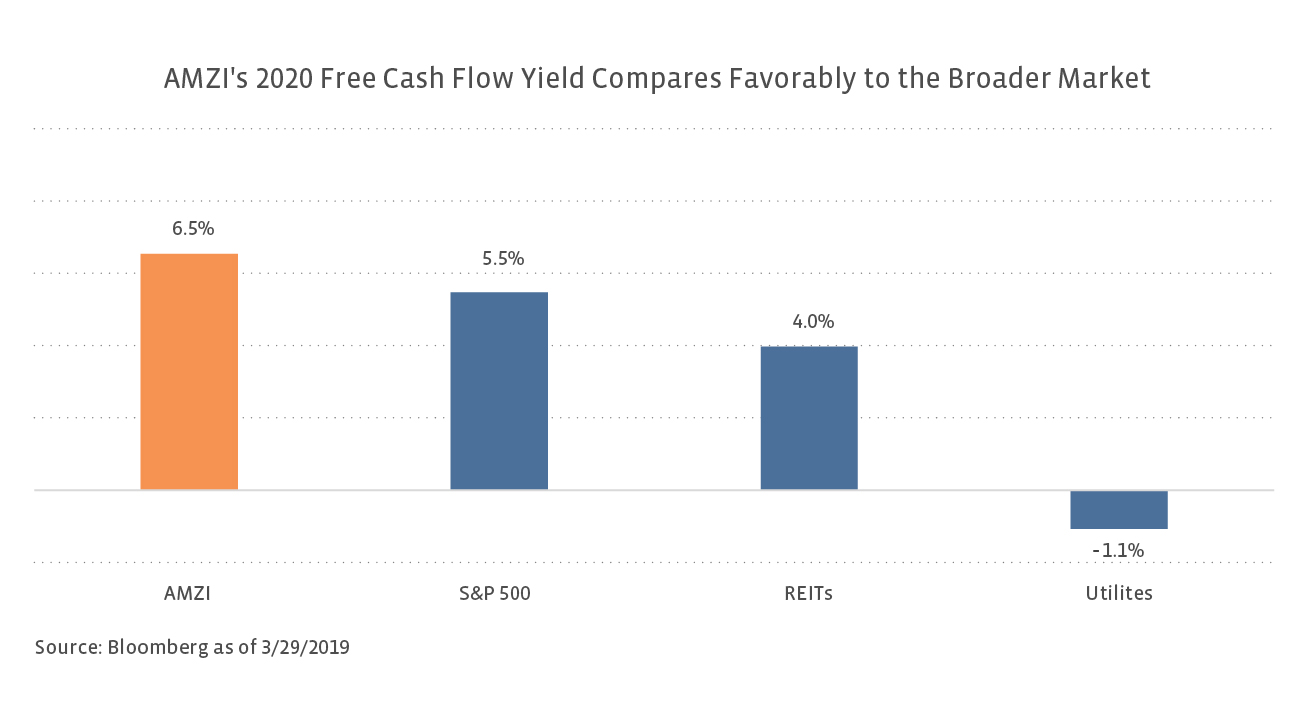
Going forward, free cash flow (FCF) yield should become a more important metric for valuing MLPs, particularly as capital spending moderates from the hefty levels of recent years as long-lead projects come online. Enterprise Products Partners (EPD) included a slide in its analyst conference presentation highlighting its growth in FCF. FCF yield is calculated by dividing FCF by a company’s market capitalization, allowing for comparison among different entities. The chart below shows current free cash flow yield based on estimated 2020 FCF per Bloomberg. REITs, as represented by the Real Estate 50 Index (FNR5), are included for additional context. While the AMZI screens favorably relative to other sectors, the 2020 FCF yield also represents a notable improvement relative to recent history. In 2016, absolute FCF for the AMZI was negative. The improvement in FCF for MLPs reflects both growing cash flow from operations and improving capital discipline.
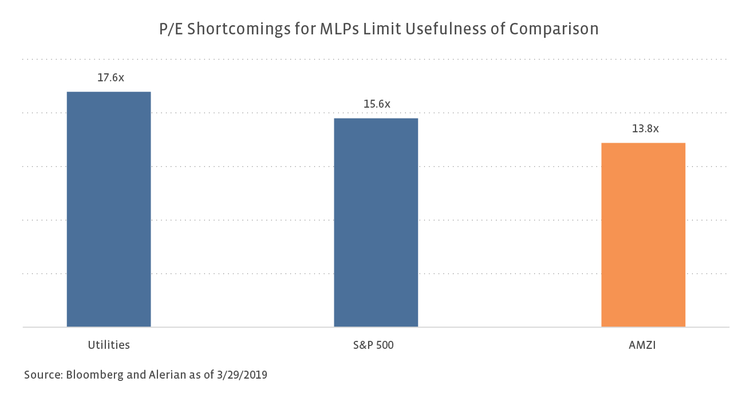
Price-to-earnings (P/E) is another metric frequently cited across sectors for valuation purposes. Setting aside relative weakness in net income compared to preferred cash-flow-based metrics, earnings per share (unit) tends to be less meaningful for MLPs. MLPs tend to have high depreciation, which results in low earnings. While acknowledging the shortcomings of the P/E ratio for MLPs, we include below the weighted average P/E ratio for the AMZI relative to Utilities and the S&P 500 for context based on 2020 estimated earnings.
Investors may look at additional return-based metrics to compare among MLPs or to compare MLPs with other sectors, including return on invested capital (ROIC) and return on equity (ROE). ROIC is an indication of how well a company is using its debt and equity to generate profits. ROIC can be a useful gauge to measure value creation from acquisitions and as a check on whether company returns align with management’s commentary on organic project returns. ROE, which compares net income to shareholder equity, will not be relevant for those MLPs with high depreciation and hence low income. EPD includes a chart of its historical unlevered ROIC and ROE in its investor presentation to highlight its returns on capital. ROIC can further be compared to a company’s weighted average cost of capital (WACC) to measure whether companies are creating value. Returns should exceed a company’s cost of capital. ROIC and ROE are useful as widely accepted and understood metrics, but each sector may have its own expected ranges, limiting broad comparisons.
Bottom Line
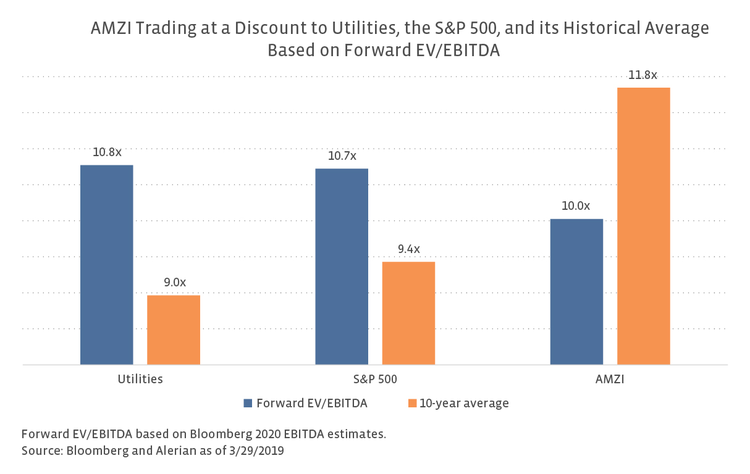
The MLP business model and capital allocation strategy has changed significantly over the last five years, which has also led to an evolving investor base. Income remains a key tenet of MLP investing, but yield-based valuation metrics do not necessarily allow for a sufficient appreciation of the positive developments in the space (lower leverage, higher coverage, self-funding equity) or a useful comparison with other sectors. The new institutional and generalist investors that MLP management teams are targeting will want to compare MLPs with other sectors using familiar valuation metrics. As a result, MLP valuation metrics should increasingly shift from yield and DCF-based methods to more recognized approaches such as EV/EBITDA and FCF yield.

