ETFdb Logo
ETFdb Logo
  • ETF Database
  • Channels
    • Themes
      • Active ETF
      • Artificial Intelligence
      • Beyond Basic Beta
      • China Insights
      • Climate Insights
      • Core Strategies
      • Crypto
      • Direct Indexing
      • Disruptive Technology
      • Energy Infrastructure
      • ETF Building Blocks
      • ETF Investing
      • ETF Education
      • ETF Strategist
      • Financial Literacy
      • Fixed Income
      • Free Cash Flow
      • Innovative ETFs
      • Institutional Income Strategies
      • Leveraged & Inverse
      • Managed Futures
      • Market Insights
      • Modern Alpha
      • Multifactor
      • Responsible Investing
      • Retirement Income
      • Tax Efficient Income
    • Asset Class
      • Equity
        • U.S. Equity
        • Int'l Developed
        • Emerging Market Equities
      • Alternatives
        • Commodities
        • Gold/Silver/Critical Minerals
        • Currency
        • Volatility
      • Fixed Income
        • Investment Grade Corporates
        • US Treasuries & TIPS
        • High Yield Corporates
        • Int'l Fixed Income
    • ETF Ecosystem
    • ETFs in Canada
  • Tools
    • ETF Screener
    • ETF Country Exposure Tool
    • ETF Sector Tracker Tool
    • ETF Database Categories
    • Head-To-Head ETF Comparison Tool
    • ETF Stock Exposure Tool
    • ETF Issuer Fund Flows
    • Indexes
    • Mutual Fund To ETF Converter
  • Research
    • ETF Education
    • Equity Investing
    • Dividend ETFs
    • Leveraged ETFs
    • Inverse ETFs
    • Index Education
    • Index Insights
    • Top ETF Sectors
    • Top ETF Issuers
    • Top ETF Industries
  • Webcasts
  • Themes
    • AI ETFs
    • Blockchain ETFs
    • See all Thematic Investing ETF themes
    • ESG Investing
    • Marijuana ETFs
  • Multimedia
    • ETF 360 Video Series
    • ETF of the Week Podcast
    • ETF Prime Podcast
    • Video
  • Company
    • About VettaFi
    • Get VettaFi’ed
  • PRO
    • Pro Content
    • Pro Tools
    • Advanced
    • FAQ
    • Pricing
    • Free Sign Up
    • Login
  1. Index Insights
  2. Worried About Missing the MLP Recovery Boat? Small Caps Still Have Furthest to Go
Index Insights
Share

Worried About Missing the MLP Recovery Boat? Small Caps Still Have Furthest to Go

Maria HalmoJun 09, 2016
2016-06-09

Let’s be honest: the Alerian team is a bunch of stat nerds. We spend a lot of time, even our personal time, just tinkering with numbers. Often, some idea will be sparked by an internal discussion, an investor question, or a cross-discipline conversation with a spouse. Recently, it was proposed to me that small cap MLPs, with their higher volatility may fall fastest and soonest, but that they are also the first to recover and can be used as a leading indicator. Intrigued, I decided to look into it.

With the recently-launched Alerian Size Indices, we have ten years of cold, hard data, which includes two major corrections, and one and a half recoveries (since we’re still in the middle of this one). During the last major financial crisis, the Alerian Small Cap MLP Index (AMSI) fell nearly 70% compared to the Alerian Large Cap MLP Index (AMLI)’s loss of almost 50%, and the decline lasted an additional five weeks. During the current period, the AMSI fell an additional 10% compared to large caps, but got there 11 days sooner. At their (near-term) peaks in the first week of June 2016, neither has fully recovered, but the AMLI is 41.3% recovered, while the AMSI is only 22.7% recovered.

2016.06.08 Fall Furthest

[Note: The Alerian Mid Cap MLP Index (AMMI) is included in all tables, but the analysis provided here is between large and small caps. Mid cap MLPs perform somewhere in the middle, but more similarly to large caps than to small caps. My colleague, James Wang, has explored the differences between the indices in depth and concluded that the AMMI “came away with the best balance of stability and performance” over the past ten years.]

Intuition Is Wrong: A Counter Example

It seems surprising, right? We can all think of small cap MLPs that have had remarkable performance in 2016. To illustrate just one: American Midstream Partners (AMID) is up nearly 300% from its lows last December. The units jumped 30% at the end of the year on the announcement that its general partner, private equity firm ArcLight, believed it was undervalued and would be purchasing $75 million in units. Then it jumped another 30% in the week following the April announcement that AMID would be cutting its distribution, a move the market viewed as prudent. That press release also included news of $225 million of acquisitions, which would increase the size of the company by over 50%.

So the first lesson we can learn from this is that the plural of anecdote is not data and human brains are fallible. AMID may have done well, but two other companies filed for bankruptcy and were removed from the AMSI. AMID may be up 300%, but two other companies are down over 90%. Even beyond that, as my brain popped up example after example, was how many of these high performing small cap MLPs have received external help. As with AMID, this could come in the form of an investment from an outside party, or a dropdown from the parent, or other payment (IDR) relief. These are positive and helpful signs the market recognizes, but importantly, they are not operational or fundamental improvements.

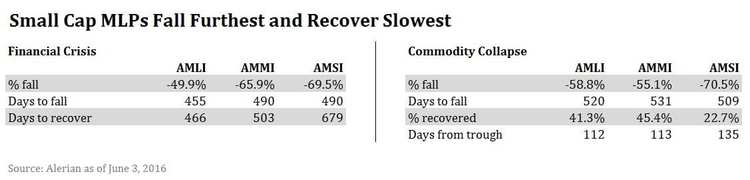
Small Caps Fall Fastest, Fall Hardest

Small cap MLPs led both bear markets, falling 50% further than large caps did in the first 100 days. Large caps managed to keep losses to 10%-20% until well over a year into the pull back. In a difficult environment, it will be those MLPs with the thinnest balance sheets and most concentrated risk that are least able to maintain business as usual. In the slow-moving, always-cautious energy infrastructure business, it appears that there is no such thing as being nimble.


Content continues below advertisement

2016.06.08 Early Days

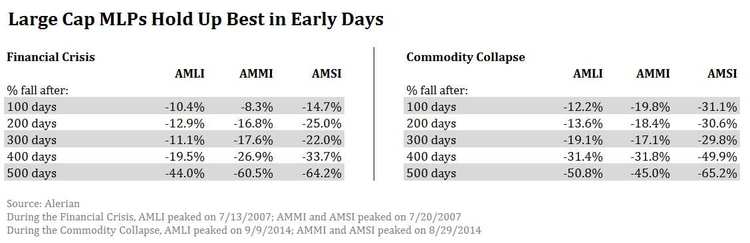
This table does raise one chicken-or-the-egg question: do large caps respond as the rest of the space is hitting a bottom, or do the falling unit prices of large caps signal the bottom?

Last Time, Large Caps Recovered and Recovered and Recovered

We are now just over 100 days into the current recovery (in the case of the AMSI: 135 days since it bottomed in January). Large caps are up over 40% and small caps are up over 20%. To compare this to the recovery during the financial crisis:

2016.06.08 Recover Steadily

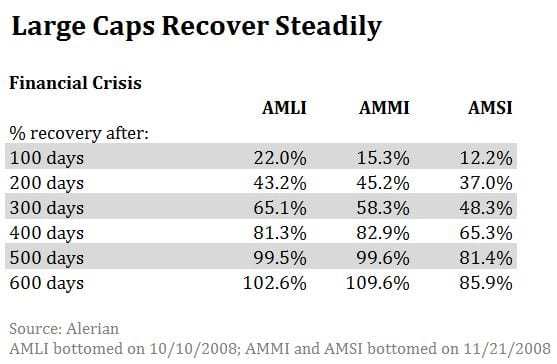
The current recovery seems to be happening much faster than the last one, as each index is already much further along than it was after 100 days back in 2009. It may be that if you aren’t already invested, you missed the first and biggest boat. Then again, we could always retest the bottoms. Or MLPs could go up 300% tomorrow. My crystal ball is cloudy today. Jokes aside, this is a data set of one (2007-2009) and as I mentioned above: the plural of anecdote isn’t data. It is entirely possible that small caps could make a steeper, faster recovery this time around.

If you believe this recovery will look like the last one, and you want to get into the game now, an investment in large cap MLPs may make sense if you don’t mind that you’ve missed the first 50% and you believe the recovery will continue at this pace. However, small cap MLPs may make sense for the portfolio of the investor who believes history will repeat, wants to get in closer to the bottom, and doesn’t mind if the recovery takes a while.

2016.06.10 11:00am CST – Edited to clarify the decline period of the AMSI. 

» Popular Pages

  • Tickers
  • Articles

Sep 29

A Fixed Income Primer for Constructing Portfolios

Sep 29

Main Management Market Note: September 29, 2023

Sep 29

Higher for Much Longer?

Sep 29

Moving Averages: S&P Ends September Down 4.9%

Sep 29

This Week in ETFs: FormulaFolios Renamed & Adds New Funds

Sep 29

Play Online Car Sales News in These 2 China ETFs

Sep 29

SEC Opens Ethereum Futures ETF Floodgates

Sep 29

VettaFi Voices On: Managing Risk in an Uncertain Economy

Sep 29

SPYI Outperforms SPY in Challenging 3rd Quarter

Sep 29

More Rate Hikes? Watch Treasury ETF USFR

QQQ

Invesco QQQ Trust Series I

SPY

SPDR S&P 500 ETF Trust

VOO

Vanguard S&P 500 ETF

TSLY

YieldMax TSLA Option Income...

VTI

Vanguard Total Stock Market...

TLT

iShares 20+ Year Treasury...

SMH

VanEck Semiconductor ETF

JEPI

JPMorgan Equity Premium...

SCHD

Schwab US Dividend Equity ETF...

XLE

Energy Select Sector SPDR...

Loading Articles...
Our Sites
  • VettaFi
  • Advisor Perspectives
  • ETF Trends
Tools
  • ETF Screener
  • Mutual Fund to ETF Converter
  • Head-To-Head ETF Comparison
  • ETF Country Exposure Tool
  • ETF Stock Exposure Tool
  • ETF Database Pro
More Tools
  • Financial Advisor & RIA Center
Explore ETFs
  • ETF News
  • ETF Category Reports
  • Premium Articles
  • Alphabetical Listing of ETFs
  • Browse ETFs by ETF Database Category
  • Browse ETFs by Index
  • Browse ETFs by Issuer
  • Compare ETFs
Information
  • Contact Us
  • Terms of Use and Privacy Policy
  • © 2023 VettaFi LLC. All rights reserved.

Advertisement

Is Your Portfolio Positioned With Enough Global Exposure?

ETF Education Channel

How to Allocate Commodities in Portfolios

Tom LydonApr 26, 2022
2022-04-26

A long-running debate in asset allocation circles is how much of a portfolio an investor should...

Core Strategies Channel

Why ETFs Experience Limit Up/Down Protections

Karrie GordonMay 13, 2022
2022-05-13

In a digital age where information moves in milliseconds and millions of participants can transact...

}
X