ETFdb Logo
  • ETF Database
  • Content Hubs
    • Themes
      • Active ETF
      • Alternatives
      • Artificial Intelligence
      • China Insights
      • Core Strategies
      • Crypto
      • Disruptive Technology
      • Energy Infrastructure
      • ETF Building Blocks
      • ETF Investing
      • ETF Strategist
      • Financial Literacy
      • Fixed Income
      • Free Cash Flow
      • Future ETFs
      • Innovative ETFs
      • Institutional Income Strategies
      • Leveraged & Inverse
      • Market Insights
      • Market Outlooks
      • Modern Alpha
      • Nuclear Energy
      • Portfolio Strategies
      • Sector Investing
      • Tax Efficient Income
      • Thematic Investing
    • Asset Class
      • Equity
        • U.S. Equity
        • Int'l Developed
        • Emerging Market Equities
      • Alternatives
        • Gold/Silver/Critical Materials
        • Cryptocurrency
        • Currency
        • Volatility
      • Fixed Income
        • Investment Grade Corporates
        • US Treasuries & TIPS
        • High Yield Corporates
        • Int'l Fixed Income
    • ETF Ecosystem
    • ETFs in Canada
    • Market Outlook
    • Crypto ETF Hub
  • Tools
    • ETF Screener
    • ETF Country Exposure Tool
    • ETF Database Categories
    • Indexes
    • Scenario Analysis
    • Watchlists
    • Head-To-Head ETF Comparison Tool
    • Mutual Fund To ETF Converter
    • ETF Stock Exposure Tool
    • ETF Issuer Fund Flows
  • Research
    • ETF Education
    • Equity Investing
    • Dividend ETFs
    • Leveraged ETFs
    • Inverse ETFs
    • Index Education
    • Index Insights
    • Top ETF Sectors
    • Top ETF Issuers
    • Top ETF Industries
  • Webcasts
  • Sectors
    • Sector Investing Content Hub
    • XLK
    • XLI
    • XLU
    • XLY
    • XLP
    • XLRE
    • Sector Power Rankings
    • XLE
    • XLC
    • XLF
    • XLV
    • XLB
  • Multimedia
    • ETF 360 Video Series
    • ETF of the Week Podcast
    • Gaining Perspective Podcast
    • ETF Prime Podcast
    • Video
  • Company
    • About VettaFi
  • PRO
    • Pro Content
    • Pro Tools
    • Advanced
    • FAQ
    • Free sign up
    • Login
  1. Innovative ETFs Content Hub
  2. There’s No Shame in Hopping On the ‘PXJ’ Bandwagon
Innovative ETFs Content Hub
Share

There's No Shame in Hopping On the 'PXJ' Bandwagon

Ben HernandezMar 09, 2021
2021-03-09

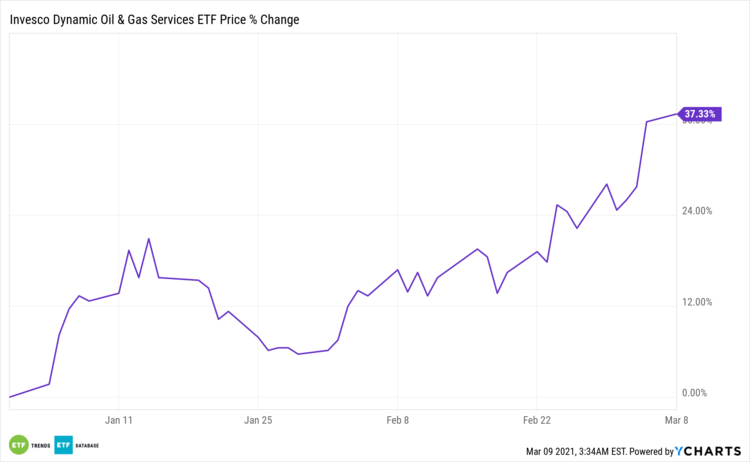
The Bloomberg Gas Oil Subindex is up almost 30% for the year, signaling the strong rally in energy and encouraging investors to hop on board the bandwagon with ETFs like the Invesco Dynamic Oil & Gas Services ETF (PXJ C).

The fund seeks to track the investment results of the Dynamic Oil Services Intellidex Index. The exchange traded fund generally will invest at least 90% of its total assets in the securities that comprise the underlying index.

The underlying index is composed of common stocks of U.S. companies that assist in the production, processing, and distribution of oil and gas. The fund is up a healthy 37% thus far in 2021.

“PXJ is likely too targeted for those with a long-term focus, but can be useful as a tactical overlay or as part of a sector rotation strategy,” ETF Database analysis points out. “PXJ is part of the suite of Intellidex product from PowerShares, meaning that this ETF is linked to an index designed to outperform traditional cap-weighted benchmarks. Those who believe this methodology has the potential to generate excess returns may find PXJ to be the ideal way to access this corner of the U.S. energy market.”

PXJ Price % Change

Stimulus Talk Is Stimulating Oil Prices

The markets in general have been feeling the positive vibes of the recent approval of a $1.9 trillion stimulus bill. Add a supply cut to oil production and things are looking fantastic. As a Reuters article notes, “oil prices rose on Tuesday on expectations of a recovery in the global economy after U.S. Senate approval of a $1.9 trillion stimulus bill and on a likely drawdown in crude oil inventory in the United States.”

“But a stronger dollar and receding fears of oil supply disruption from Saudi Arabia after an attack on its oil facilities capped price gains,” the article added.

“Fundamentals remain incredibly supportive, especially with Saudi Arabia in full control pursuing a tight oil policy,” Stephen Innes, chief global markets strategist at Axi said in a note.

“Brent is currently holding up above $68, suggesting speculators are likely dipping their toes back in after yesterday’s chaos.”

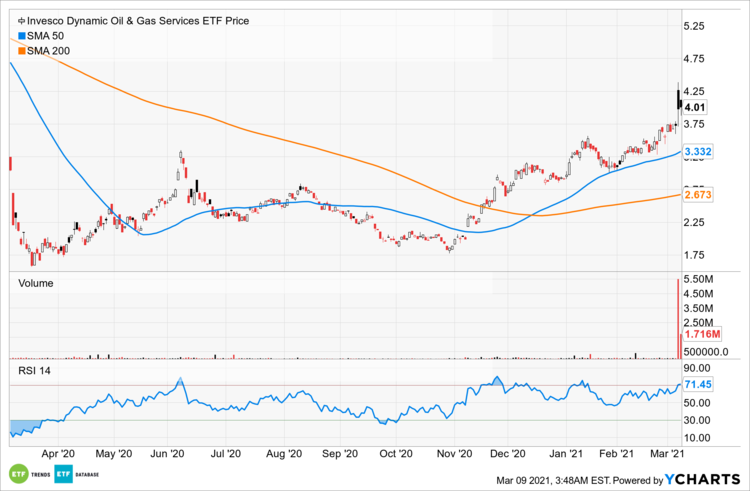
The confluence of events fits nicely into strength for PXJ. The fund has momentum on its side when looking at the one-year chart, which shows an overbought reading of 71.45 as the fund rose higher following the ‘golden cross’ back on December 14, 2020 when the 50-day moving average crossed up the 200-day moving average.


Content continues below advertisement

PXJ Performance Figures

For more news and information, visit the Innovative ETFs Channel.

Loading Articles...

Advertisement

Is Your Portfolio Positioned With Enough Global Exposure?

ETF Education Channel

How to Allocate Commodities in Portfolios

Tom LydonApr 26, 2022
2022-04-26

A long-running debate in asset allocation circles is how much of a portfolio an investor should...

Core Strategies Channel

Why ETFs Experience Limit Up/Down Protections

Karrie GordonMay 13, 2022
2022-05-13

In a digital age where information moves in milliseconds and millions of participants can transact...

}
X