
ETFdb Logo
  • ETF Database
  • Content Hubs
    • Themes
      • Active ETF
      • Alternatives
      • Artificial Intelligence
      • China Insights
      • Core Strategies
      • Crypto
      • Disruptive Technology
      • Energy Infrastructure
      • ETF Building Blocks
      • ETF Investing
      • ETF Strategist
      • Financial Literacy
      • Fixed Income
      • Free Cash Flow
      • Future ETFs
      • Innovative ETFs
      • Institutional Income Strategies
      • Leveraged & Inverse
      • Market Insights
      • Market Outlooks
      • Modern Alpha
      • Nuclear Energy
      • Portfolio Strategies
      • Sector Investing
      • Tax Efficient Income
      • Thematic Investing
    • Asset Class
      • Equity
        • U.S. Equity
        • Int'l Developed
        • Emerging Market Equities
      • Alternatives
        • Gold/Silver/Critical Materials
        • Cryptocurrency
        • Currency
        • Volatility
      • Fixed Income
        • Investment Grade Corporates
        • US Treasuries & TIPS
        • High Yield Corporates
        • Int'l Fixed Income
    • ETF Ecosystem
    • ETFs in Canada
    • Crypto ETF Hub
  • Tools
    • ETF Screener
    • ETF Country Exposure Tool
    • ETF Database Categories
    • Indexes
    • Scenario Analysis
    • Watchlists
    • Head-To-Head ETF Comparison Tool
    • Mutual Fund To ETF Converter
    • ETF Stock Exposure Tool
    • ETF Issuer Fund Flows
  • Research
    • ETF Education
    • Equity Investing
    • Dividend ETFs
    • Leveraged ETFs
    • Inverse ETFs
    • Index Education
    • Index Insights
    • Top ETF Sectors
    • Top ETF Issuers
    • Top ETF Industries
  • Webcasts
  • Sectors
    • Sector Investing Content Hub
    • XLK
    • XLI
    • XLU
    • XLY
    • XLP
    • XLRE
    • Sector Power Rankings
    • XLE
    • XLC
    • XLF
    • XLV
    • XLB
  • Multimedia
    • ETF 360 Video Series
    • ETF of the Week Podcast
    • Gaining Perspective Podcast
    • ETF Prime Podcast
    • Video
  • Company
    • About VettaFi
  • PRO
    • Pro Content
    • Pro Tools
    • Advanced
    • FAQ
    • Free sign up
    • Login
  1. Innovative ETFs Content Hub
  2. Low Volatility Seekers Are Piling Into This Invesco ETF
Innovative ETFs Content Hub
Share

Low Volatility Seekers Are Piling Into This Invesco ETF

Ben HernandezAug 25, 2021
2021-08-25

Rising COVID-19 cases have pushed many investors back into a defensive stance against volatility, to the benefit of the Invesco S&P 500 Low Volatility ETF (SPLV A+).

Volatility, as defined, is a statistical measurement of the magnitude of up-and-down asset price fluctuations over time.

The fund and the index are re-balanced and reconstituted quarterly in February, May, August, and November.

“SPLV has gathered assets in the past month in contrast to peer USMV,” a CFRA Funds in Focus report noted. “Invesco’s portfolio of the least volatility 100 stocks in the S&P 500 Index amassed $1.4 billion of new money in the one-month period ended August 20, erasing prior redemptions and pushing the year-to-date net inflows total to approximately $320 million, according to CFRA’s ETF data.”

“SPLV climbed 3.3% in the past month, ahead of 1.8% gain for SPDR S&P 500 ETF (SPY 443 *) as the more defensive approach added value,” the report added.

The fund is based on the S&P 500® Low Volatility Index and seeks to invest at least 90% of its total assets in common stocks that comprise the Index. The index is compiled, maintained, and calculated by Standard and Poor’s and consists of the 100 stocks from the SP 500 Index with the lowest realized volatility over the past 12 months.

A Shift Toward Defense

A shift toward more defensive sectors took place this month for SPLV. Sectors that lack the panache of big tech like utilities and consumer staples are back in favor for the fund.

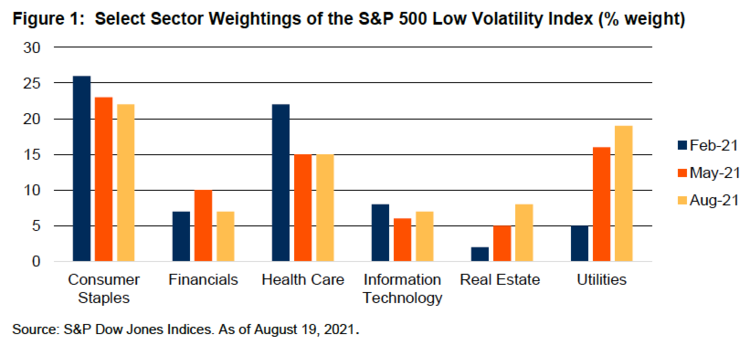
“SPLV increased its exposure to certain defensive sectors during its August rebalance,” the CFRA report said. “The S&P index behind SPLV is rebalanced on a quarterly basis, with the latest changes occurring last week. Exposure to higher-dividend yielding sectors such as real estate and utilities continued to climb from the February and May levels, as shown in Figure 1.”

“Utilities now represents 19% of assets, up from 16% and 5% in May and February, respectively, while real estate is 8%, up from 5% and 2%,” the report added. “Meanwhile, stakes consumer staples and health care were 22% and 15% of the portfolio, down from the 26% and 22% weights in February, though little changed from May. The financials sector shrunk the most in August, with the weight falling back to the 7% February level, after initially climbing to 10% in May.”

Content continues below advertisement

Invesco Figure 1

For more news and information, visit the Innovative ETFs Channel.

Loading Articles...

Advertisement

Is Your Portfolio Positioned With Enough Global Exposure?

ETF Education Channel

How to Allocate Commodities in Portfolios

Tom LydonApr 26, 2022
2022-04-26

A long-running debate in asset allocation circles is how much of a portfolio an investor should...

Core Strategies Channel

Why ETFs Experience Limit Up/Down Protections

Karrie GordonMay 13, 2022
2022-05-13

In a digital age where information moves in milliseconds and millions of participants can transact...

}
X
