

With the Nasdaq 100 down about 3% the past week, the technology sector has certainly seen better days. The current sell-off isn’t just relegated to the heaviest hitters in the U.S., but also globally. Given this, low-volatility ETFs may seem like the ideal route to seek shelter from the sell-off. However, while two funds may share the same investment thesis, the underlying holdings tell a different story. Such is the case with the Invesco S&P 500 Low Volatility ETF (SPLV ) and the iShares MSCI USA Min Vol Factor ETF (USMV ).
Key Takeaways
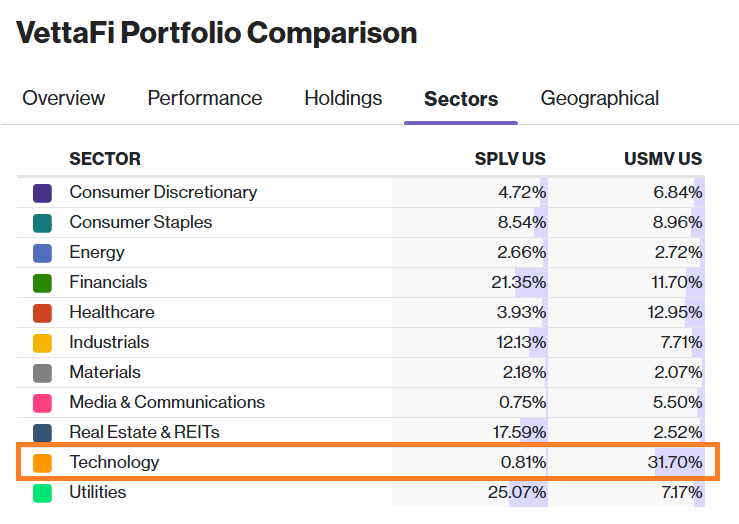
- The sector-agnostic SPLV holds less than a 1% weighting in technology, rotating instead into defensive anchors like utilities and financials to shield against tech sell-offs.
- USMV must match its parent index sector weights, maintaining a 33% footprint in tech that leaves it exposed to performance drag during industry-wide pullbacks.
- SPLV operates as a purely unconstrained defensive vehicle with an almost perfectly equal-weighted portfolio, while USMV uses optimization rules that create a slightly more top-heavy exposure.
See More: The Qs Shift Gears: Nasdaq 100 Rebalances While SpaceX Looms
SPLV: Pure-Play Tactical Refuge
When tech experiences a patch of market turbulence, it also affects the broader market given its heavy weight in major indexes. The S&P 500 falling 2% the last five trading days is obvious evidence of its influence.
When the S&P 500 starts to shake, rattle, and roll, low-volatility stocks could make the ride smoother. In the case of SPLV, it tracks the S&P 500 Low Volatility Index (Index). As its name explicitly says, the Index identifies 100 stocks within the S&P 500 exhibiting the lowest realized volatility over the trailing 12 months. Moreover, the fund is also sector-agnostic so the lack of this constraint means it can sidestep sectors seeing heavy price fluctuations.
With this sector-neutral mandate in place, it carries less than a 1% weighting in tech. Instead, the fund rotates its capital into traditional defensive strongholds like utilities, consumer staples, and financials. When tech sells off violently, SPLV acts as somewhat of a defensive shield, warding off the effects of systemic liquidation in mega-cap tech names.
USMV: Optimized Minimum Volatility
In contrast to SPLV, USMV tracks the MSCI USA Minimum Volatility Index. It identifies large- and mid-cap names displaying strong value characteristics according to price-to-book, forward earnings, enterprise value-to-cash flow metrics, and of course, low volatility. Selected constituents are then normalized to match its parent index sector weights.
Because the parent index, the MSCI USA Index, is heavily dominated by mega-cap tech names, USMV maintains a 33% footprint in the tech sector. Although it targets the lowest-volatility companies within the sector, its structural constraints means it can’t completely abandon tech. During a broad tech rout such as now, this exposure means USMV will likely experience performance drag that SPLV can avoid.
Where SPLV and USMV Differ
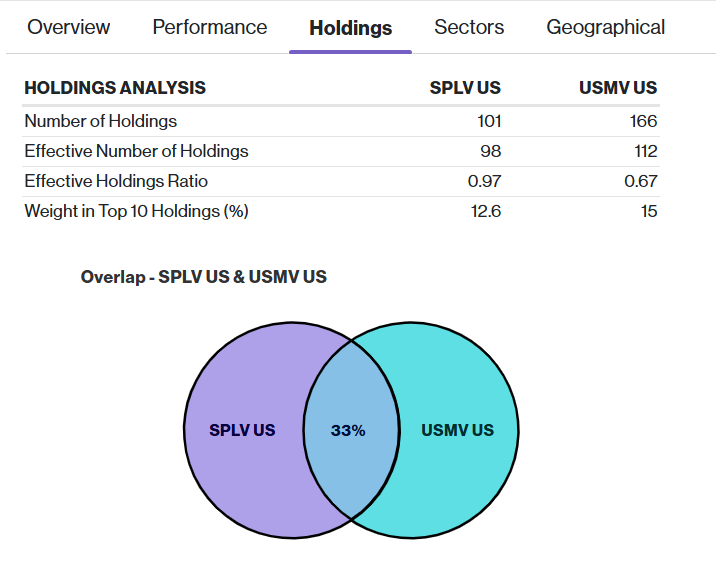
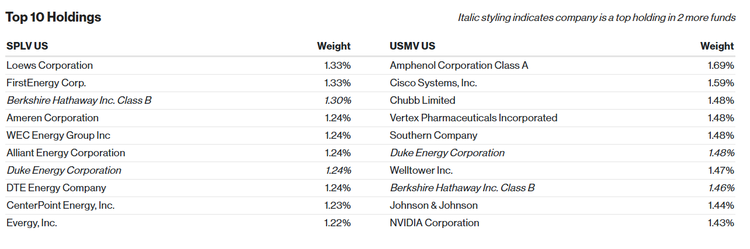
The obvious contrast between the two funds is the aforementioned exposure to tech. While the two have a 33% overlap, the holdings analysis further shows where the two funds differ in how they construct their portfolios. SPLV functions as a pure, unconstrained defensive vehicle. The fund yields a 0.97 effective holdings ratio (1 being absolutely equally weighted), which means it distributes capital almost evenly across its positions. Conversely, USMV features a more top-heavy footprint with a lower 0.67 ratio though its top holding isn’t more than a 1.7% allocation (as of 6/22/26). It’s driven by strict optimization rules that concentrate a higher percentage of the portfolio within its top 10 allocations.
Getting more granular with the top holdings, SPLV anchors its portfolio in ultra-defensive utilities like FirstEnergy and Ameren. Top holdings also include financials like Berkshire Hathaway and Loews, leaving it effectively insulated from tech sector volatility.
USMV retains a much higher sensitivity to growth metrics. The current tech rout directly impacts notable allocations to high-beta, AI infrastructure-linked hardware names like Amphenol Corporation and NVIDIA.
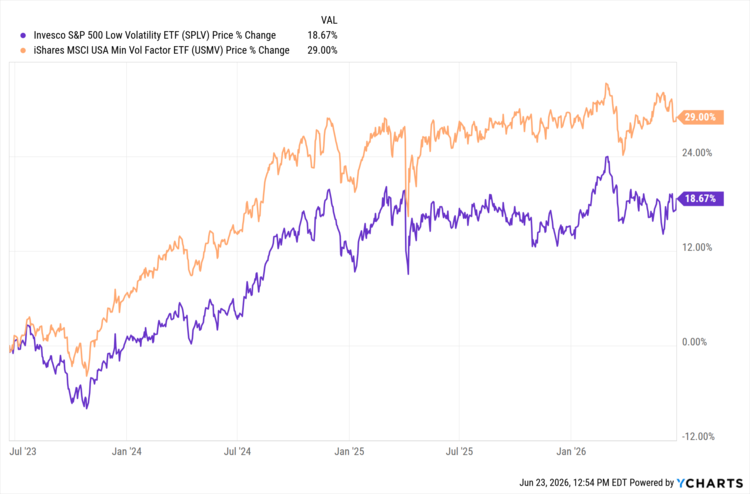
In terms of performance, less tech exposure has allowed SPLV and USMV to diverge at the beginning of June when looking at the year-to-date chart. The disparity, of course, has been more recently pronounced in the past week amid the sell-off.
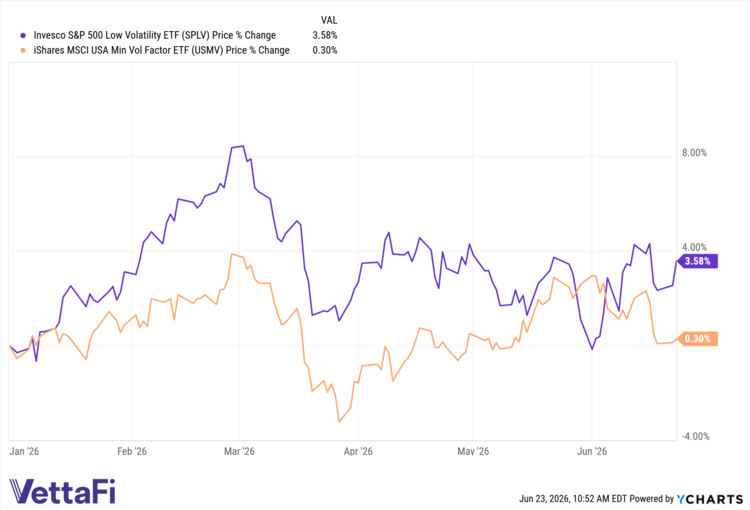
However, there’s no denying the strength of tech when that performance timeframe is stretched to the past few years. USMV is outpacing the SPLV by just over 10 percentage points.
Positioning for Volatility
Of course, performance shouldn’t be the defining factor when deciding where to allocate. SPLV is ideal for investors who believe the tech sell-off is potentially at the start of a structural, prolonged growth unwind and therefore, wishes to avoid the sector. USMV may suit those who view the tech pullback as a brief, temporary consolidation and want a smoother, risk-mitigated ride without abandoning their long-term growth positioning.
Alternatively, investors can combine both funds together to create a more comprehensive, low-volatility sleeve. Whichever path is ultimately chosen, the primary point is understanding the methodologies both funds use whenever volatility strikes.
| Feature | Invesco S&P 500 Low Volatility ETF | iShares MSCI USA Min Vol Factor ETF |
|---|---|---|
| Ticker | SPLV | USMV |
| Issuer | Invesco | BlackRock (iShares) |
| Strategy Type | Pure Low Volatility | Minimum Volatility |
| Technology Weight | Less than 1% | ~33% Sector Footprint |
| Sector Constraints | Unconstrained (Based on volatility) | Constrained (Match parent index) |
| Number of Holdings | 101 | 166 |
| Effective Holdings Ratio | 0.97 (Highly Equal-Weighted) | 0.67 (More Top-Heavy Exposure) |
| Weight in Top 10 | 12.60% | 15.00% |
| Underlying Index | S&P 500 Low Volatility Index | MSCI USA Minimum Volatility Index |
| Selection Universe | S&P 500 | MSCI USA Index |
| Expense Ratio | 0.25% | 0.15% |
For more news, information, and analysis, visit the Innovative ETFs Content Hub.

