
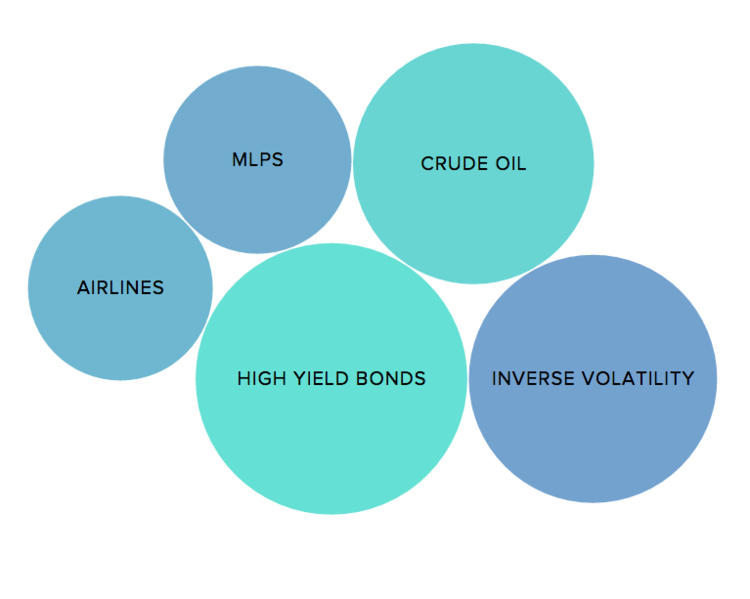
The analysts here at ETF Database analyzed the search patterns of visitors to our site during the past week. Below, you’ll find our analyses of the top five trends. By analyzing these trends, we hope to unlock a better understanding of the investment themes trending on our site and in the market.
High Yield
High-yield bond ETFs have been the talk of the markets over the past week. Our High-Yield Bond ETFs page saw an increase of 147% in traffic from last week. When high-yield bonds start to suffer, it usually means that liquidity is drying up. In 2009, investors put billions of dollars into the U.S junk bond market, increasing the issuance of bonds by low-rated companies.
Last week, U.S. junk bonds posted their largest decline since 2011 after Third Avenue Management liquidated its $789 million Focused Credit Fund. The fund was not your typical mainstream junk bond fund since it invested in distressed debt. Third Avenue thus faced a liquidity problem when it couldn’t sell bonds quickly enough to meet investor demands for cash without taking a deep loss in bond prices. Monday, Lucidus Capital Partners liquidated its holdings as well and returned cash to investors.
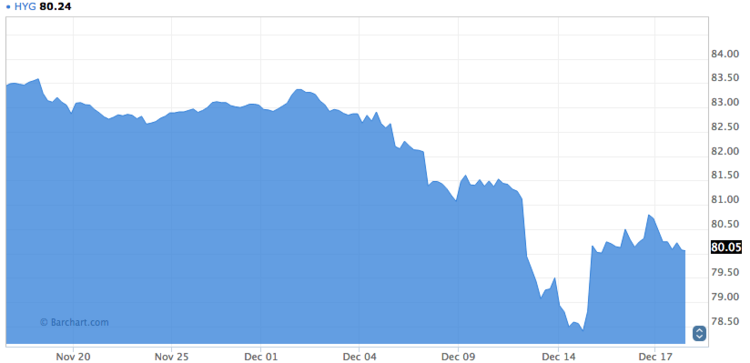
The problem with these high-yield bonds is that there is currently about $2.5 trillion in debt held by junk-rated companies in the U.S., more than half of which matures in the next five years. For more information read Are High-Yield Bonds in Trouble? According to Carl Icahn, this is just the beginning: “Unfortunately I believe the meltdown in High Yield is just beginning” he tweeted on Friday. Also, JPMorgan is forecasting that the default in energy sector companies will hit 10% next year. The largest high-yield ETF, the iShares iBoxx $ High Yield Corporate Bond (HYG ), fell 2% on Friday and was down more than 1% on Monday. After the Federal Reserve’s decision on Wednesday to raise benchmark interest rates, U.S. junk bonds got a boost. According to Bill Gross, the sell-off in junk bonds makes this the perfect time to invest in the asset class.
Inverse Volatility
Our Inverse Volatility ETFs page was trending this week, with an increase in traffic of 96%. Increase in volatility is usually a reflection of investor anxiety. There are two main causes for this market volatility: the first was the oil price slump, which continues to make the headlines; and the second happened last week when there was a huge sell-off in high-yield bonds, shocking the markets.
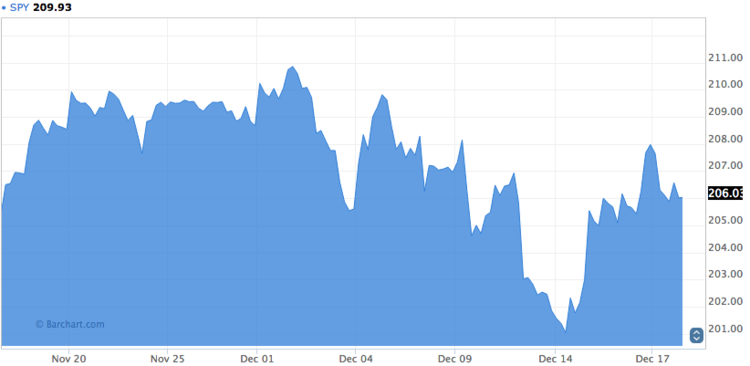
Investors are looking for ways to hedge their positions against market volatility by investing in inverse volatility ETFs. After the rate hike from the U.S Federal Reserve, the major indexes rallied up, but on Thursday they continued on a downward trend, with SPY down more than 1%. Going forward based on cyclicality, we tend to see the January effect already in place in late December. A good way to try to hedge your portfolio is to look not just for inverse volatility ETFs but also for inverse index ETFs, such as the Short Dow30 (DOG ) or the Short S&P500 (SH ).
Crude Oil
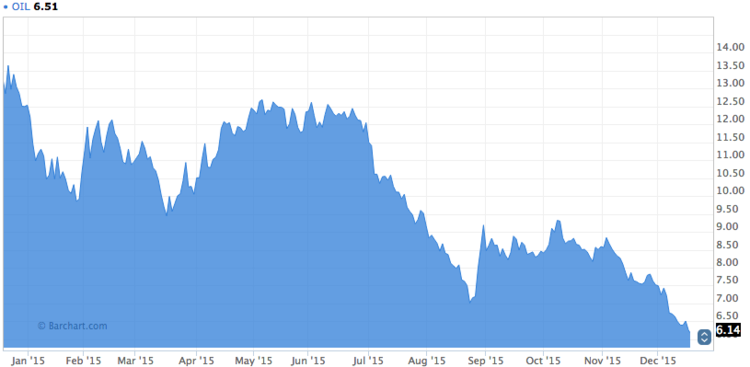
The Crude Oil ETFs page was also trending this week, with an increase in traffic of 83%. This commodity continues to make headlines in the market as it reaches multiyear lows. The International Energy Agency (IEA) Oil Market Report indicates that world demand growth for Q4 2015 will slow down to 1.3 million barrels per day year over year from a peak of 2.2 million barrels per day in Q3 2015. The growth of 1.8 million barrels per day in 2015 is mainly sustained by demand from China, the U.S. and India. It is forecasted that growth in world demand for 2016 will be only 1.2 million barrels per day.
Total oil output is still increasing despite cuts at U.S. shale firms. Baker Hughes stated that the U.S. oil rig count fell by 21 rigs last week, down to 524 rigs. Tuesday, congressional leaders agreed to lift the 40-year-old U.S. ban on crude oil exports; in the short run this lift will have little impact on American shale firms. In addition, this week the U.S. Energy Administration released its U.S. inventory figures; oil supplies in the U.S. rose to 4.8 million barrels last week. The market expected supplies to drop by 1.5 million barrels.
One of the main concerns for 2016 is the rising OPEC production going forward. It is important to keep in mind that early next year sanctions from Iran are expected to be lifted. What this means for oil prices is that there might be more downward pressure in 2016 as Iran could double production to 1 million barrels per day
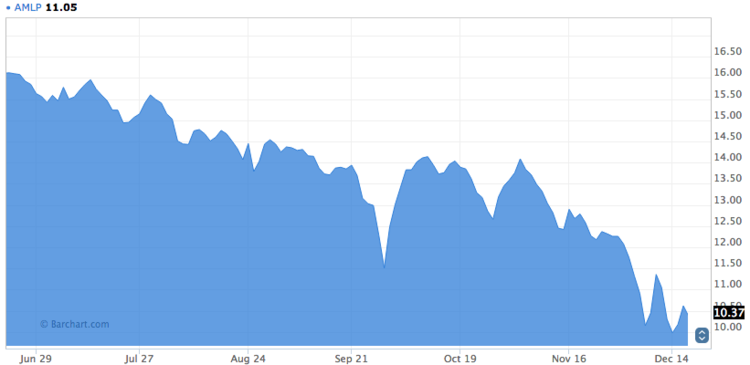
MLPs
The Energy MLP ETFs page saw traffic increase by 75%. The MLPs sector has experienced a downturn this year. The current decrease in the price of oil has definitely affected businesses that move this commodity. MLPs generally pay dividends from their cash flows; for example, large-cap MLPs have a yield between 10% and 15%. However, Kinder Morgan, the largest pipeline company, cut its dividend by 75%. Going forward, we see a likelihood of more MLPs cutting their dividend yields. MLPs tend to carry a lot of debt and are heavily dependent on issuing stocks as well as borrowing money. With the current hit in MLPS as well as higher interest rates we see the MLP industry taking a hit in 2016.
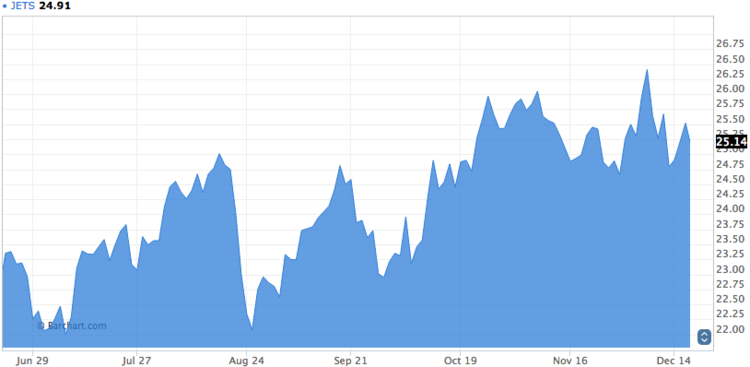
Airlines
The Airlines ETFs page had an increase in traffic of 49%. Airlines will end the year as one of the best-performing industries in 2015. As the outlook for oil prices going into 2016 remains bearish, we continue to see a decrease in one of this industry’s main input costs, increasing their earnings and balance sheets. As we come close to the end of the year, we see this industry’s many stocks trading close to their 52-week highs. The International Air Transport Association said in early December that the airline industry is expected to post a profit of $36.3 billion in 2016, based on lower oil prices and stronger travel demand.
The Bottom Line
The biggest trends this week generated more volatility in the markets and we saw how high-yield bonds and oil continued to shake the markets. We also saw crude oil falling to an 11-year low. The reduction in the price of oil leads to an increase in consumer discretionary income, which will continue to lift the airline industry in 2016. However, the negative effect continues to be the capital depreciation of oil-producing and MLP investments.
By analyzing how you, our valued readers, search our property each week, we hope to uncover important trends that will help you understand how the market is behaving so you can fine-tune your investment strategy. At the end of the week, we’ll share these trends, giving you better insight into the relevant market events that will allow you to make more valuable decisions for your portfolio.

