
This week’s trending ETFs are centered on global markets and currencies. Brazil’s economy has bottomed out over the last few years but shows signs of growth potential. MLPs have seen a slight uptick with large movements from oil and natural gas. With U.S. President Trump and Chinese President Xi meeting this week, the Chinese yuan has seen increased interest with talks of currency manipulation. European equities gained exposure with Brexit starting last week. As U.S. markets sell-off, volatility in the market is increasing.

Brazil May Lower 2018 Inflation Target as Recession Still Weighs
This week’s largest increase in interest focused on Brazil, up 33% for the week. The Brazilian economy has been going through a deep recession over the last couple of years, as Finance Minister Henrique Meirelles said last month that fourth-quarter economic data confirmed the worst downturn on record. However, there are various leading economic indicators from cardboard, motorcycle production and supermarket sales that indicate Brazil may have reached bottom and is now on the rebound. The minister believes the economy can grow at an annualized rate of 3.2%. On this news, the target for 2018 for inflation will need to be lowered as they also decide the target goal for 2019.
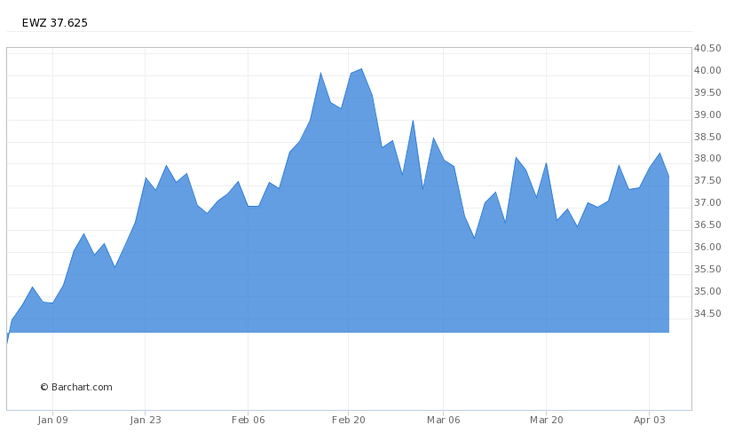
However, even though the economy has suffered over the last year, Brazilian stocks have not. The ETF with the most assets under management is the iShares MSCI Brazil Capped ETF (EWZ ). The fund is up 2.91% for the week and up 14.70% on a year-to-date basis. What is more impressive is that the fund is up 52.67% for the trailing one year. Investors looking for other Brazilian ETFs, click here.
MLPs Gain Interest With Movements From Oil and Natural Gas
Master limited partnerships (MLPs) are often mistaken by investors to be highly correlated with the price of oil and natural gas. With oil falling below the $50-per-barrel mark and down over 7% for the month, MLPs have remained relatively flat. This might have been offset by the uptick in natural gas prices, which are up over 13% this month. Because of this erratic movement, MLP ETFs have seen a 28% increase in interest over the last week, even though the companies only transport oil and natural gas.
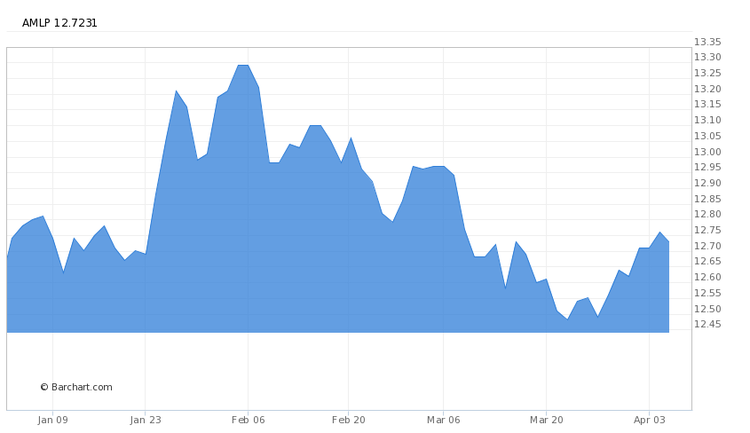
The largest MLP fund is the Alerian MLP (AMLP ), which currently has over $10.8 billion in total assets under management. The fund is up 1.59% for the week and up 3.00% on a year-to-date basis. However, it has seen a major bounce back of 32.55% in the trailing one-year period, after suffering a major pullback when oil prices declined rapidly in the years prior.
For a list of Oil & Gas ETFs, click here.
Chinese Currency Moves Ahead of Trump/Xi Meeting
Chinese President Xi is meeting with U.S. President Trump this week to talk about trade policy between the two world powers. President Trump has claimed that China is a “grand champion” of currency manipulation and that U.S. exports have suffered from the devaluation of the yuan. However, the yuan has increased 1.4% against the U.S. dollar this year and many investors are flocking to the ETF to gain exposure to large potential price movements.
The WisdomTree Chinese Yuan Strategy Fund (CYB ) is a great way to gain exposure to the Chinese currency’s movements. Over the last week, it has seen little movement and is up only 0.04%. However, it is up considerably on a year-to-date basis of 4.00% and has outperformed owning the currency outright. This is because the fund generates most of its return looking at the yield on CNY and CNH forward contracts, which anticipate what the price of the currency will be.

Europe Stocks Gain as Brexit Begins
With the UK officially beginning Article 50 last week, the divorce of Britain from the European Union has started its two-year process. Europe has shown an increase of 23% in interest, as investors are intrigued by the impact Britain really had on the EU’s bottom line. This was also paired with March’s inflation data being released on Friday that showed the eurozone had consumer prices increase by 1.5%. This is lower than analyst expectation of 1.8% and down from the 2% in February. This contributed to the ECB’s current monetary policy path and the slower rise in energy and food prices.
Investors looking to gain exposure to European stocks can be done through the WisdomTree Europe Hedged Equity Fund (HEDJ ). This fund is designed to provide exposure to the European equity market, but with an added hedging exposure to fluctuations between the U.S. dollar and the euro. The fund is one of the better performers in the space on a year-to-date figure, up 9.46%. It has also performed well for the week, up 0.58%, and up 25.75% for the trailing one year.
For a list of all the European equity ETFs, click here.

Markets Increase Volatility Over Last Month
With fear of the Trump rally coming to an end and the market near its all-time high, investors have been very weary of the equity markets over the last few weeks. Although up 4.48% on a year-to-date basis, the Dow Jones Industrial Average is still 467 points below its all-time high of 21,115 from March 1. Since then, the DJIA is down 2.22%, as investors begin selling off with uncertain expectations surrounding Trump’s policies and the impact Brexit will have on Europe.
When investors are nervous about the market, volatility tends to spike, which is measured by the CBOE Volatility Index (VIX). When investors are frantically buying or selling, the VIX will increase or decrease at a rapid pace. To gain exposure to this index, the iPath S&P 500 VIX Short-Term Futures ETN (VXX ) is a close measure. The fund has done very poorly on a year-to-date basis, down 38.53%. However, over the last week, the fund has increased 0.90% and could show more of an uptick as investors start selling off to silence their fears of a major correction.

Find the Trends title and page link using the ETF Database news section.
For more ETF news and analysis, subscribe to our free newsletter.

