
News
To help investors keep up with the markets, we present our ETF Scorecard. The Scorecard takes a step back and looks at how various asset classes across the globe are performing. The weekly performance is from last Friday’s open to this week’s Thursday close.
- The scorecard took a break last week due to the Easter holidays, while this week was somewhat slow in data given that many world markets were closed on Monday.
- U.S. President Donald Trump and China continued their trade war rhetoric. China was quick to identify $50 billion worth of U.S. goods to slap tariffs on, in retaliation to Trump’s threats to impose import taxes on a similar amount of Chinese goods. China’s overall message was clear: the country does not want a trade war but it is not afraid of one.
- U.S. Manufacturing Index dropped slightly in March, from 60.8 to 59.3, easing back from February’s 14-year high. Consensus estimates for the figure stood at 60.
- German retail sales disappointed in February, declining by 0.7% and falling well short of expectations. Analysts had predicted the retail sector would rise by 0.7%, after falling by 0.3% last week.
- U.K. Manufacturing PMI came in largely in line with expectations at 55.1 and slightly up compared with the previous month.
- ADP’s employment report pointed to another blockbuster month for the job market, with the U.S. economy adding 241,000 jobs in March. The data for the previous month was revised up by 11,000 to 246,000.
- European inflation continues to head down, with core CPI dropping to 1% in March from 1.1% in February. The headline number, however, stood still at 1.4%, below the European Central Bank’s target of 2%.
- U.S. crude oil inventories fell by 4.6 million in the week ended March 30 to 425 million, more than 20% below their year-ago level. In the prior week, crude stockpiles registered a small advance of 1.6 million barrels.
- U.S. unemployment claims delivered a nasty surprise, popping 24,000 higher to 242,000 for the week ended March 31. The rise came after claims hovered near record-low levels for several months.
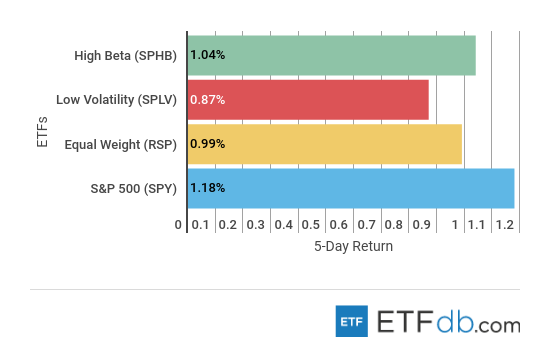
Risk Appetite Review
- Markets have broadly recovered in the past three days, after a disappointing start to the week.
- The broad market (SPY ) was the best performer for the week, recording gains of more than 1%. At some point during the week, (SPY ) was down nearly 3%.
- Low Volatility (SPLV ), meanwhile, was the worst performer with an advance of just 0.87%.
- Sign up for ETFdb.com Pro and get access to real-time ratings on over 1,900 U.S.-listed ETFs.
Content continues below advertisement
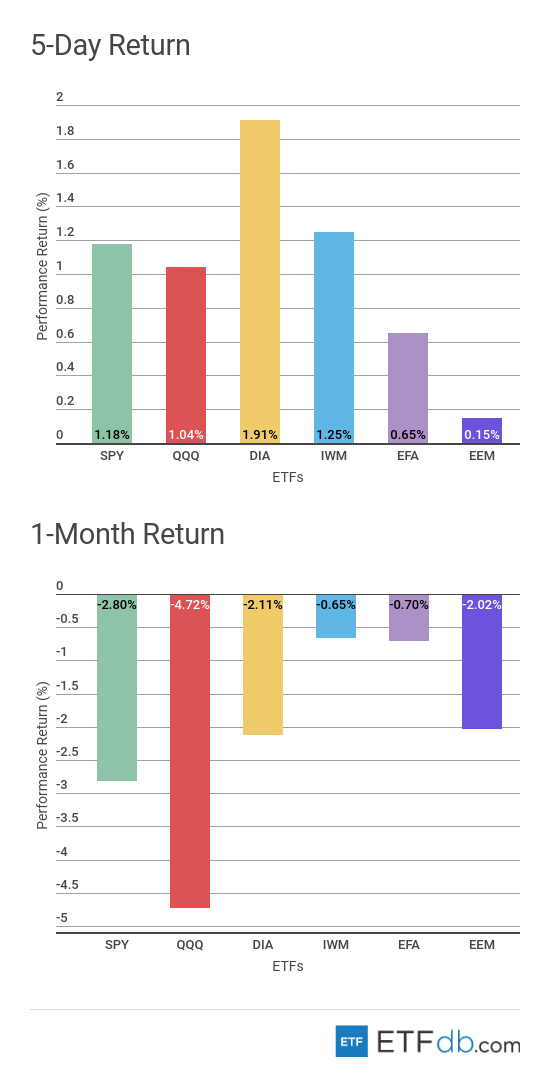
Major Index Review
- Dow Jones (DIA ) was the best performer from the pack this week, rallying nearly 2%.
- Emerging markets (EEM ), meanwhile, were up just 0.15% due to trade war jitters between China and the U.S.
- For the rolling month, the technology index (QQQ ) is the worst performer, as its two large exponents, Amazon (AMZN) and Facebook, were hit by Donald Trump’s tweets and a data breach scandal, respectively. (QQQ ) fell 4.72% in the past 30 days.
- Small cap stocks (IWM ), meanwhile, were the best performers for the rolling month, falling by just 0.65%, as the index is relatively insulated from the trade war rhetoric.
- To see how these indices performed a week before last, check out ETF Scorecard: March 23 Edition.
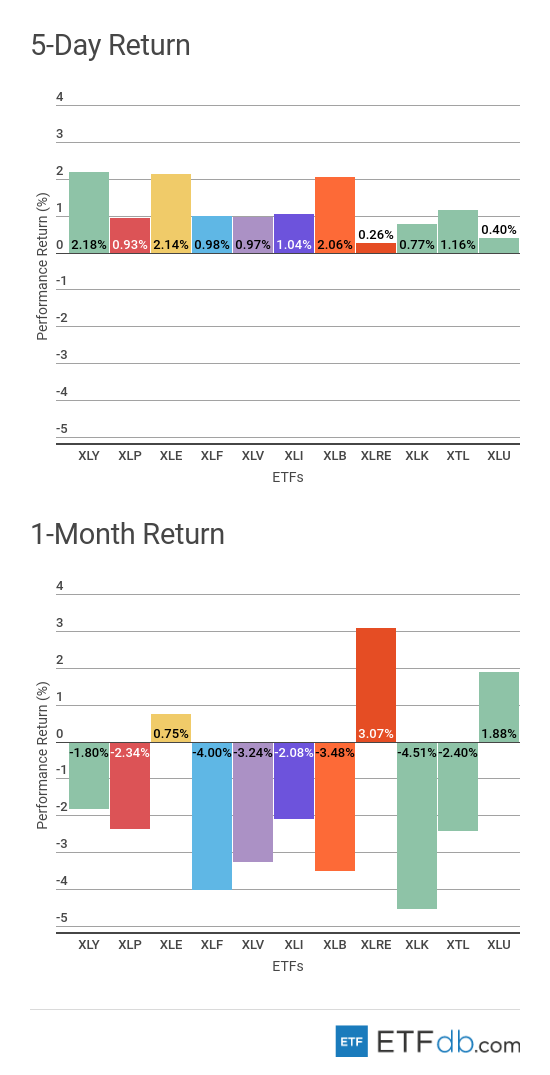
Sectors Review
- Sectors were all up.
- Consumer discretionary (XLY ) gained the most this week, advancing 2.18%.
- Meanwhile, the real estate sector (XLRE ) was the worst performer with a rise of just 0.26%.
- For the rolling month, utilities (XLU ) was one of the better performers, rallying 1.88%, as investors were in search of safe havens during the most recent market decline.
- Unsurprisingly, the technology sector (XLK ) is the worst performer for the rolling month, dropping as much as 4.51%.
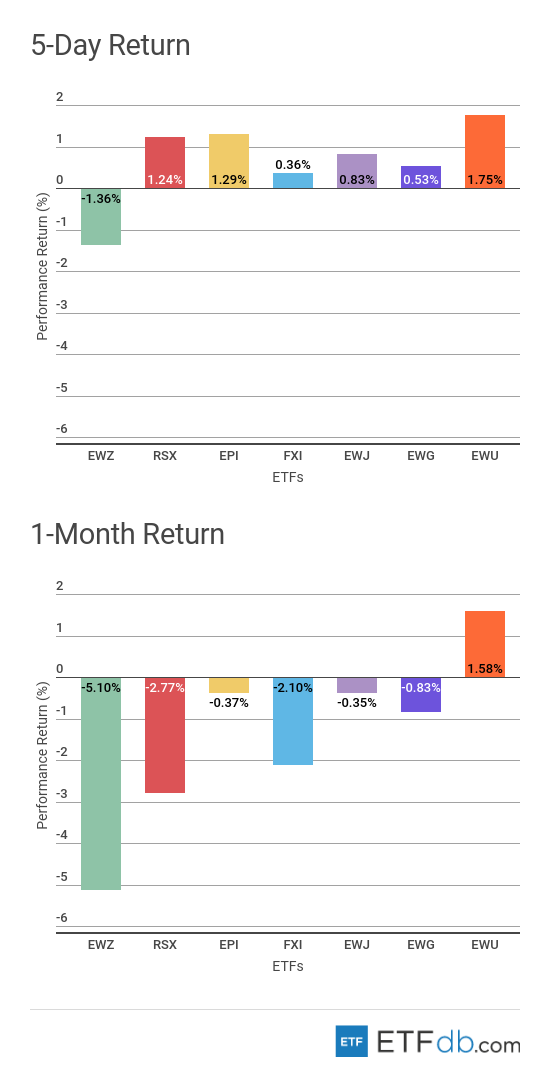
Foreign Equity Review
- Foreign equities were all up, with one exception.
- British equities (EWU ) performed the best during the tumultuous period, as investors were encouraged by Brexit negotiations. It appears that there is an entire movement seeking to reverse Brexit and even hold a second referendum. (EWU ) was the best performer both for the week and the rolling month, surging 1.75% and 1.58%, respectively.
- Meanwhile, Russia (RSX ) performed poorly during the rolling month, tumbling 2.77%. Russia was largely hit by a deterioration of its relationship with the Western world after Britain accused it of murdering a former spy and his daughter on British soil.
- To find out more about ETFs exposed to particular countries, check our ETF Country Exposure tool. Select a particular country from a world map and get a list of all ETFs tracking your pick.
Commodities Review
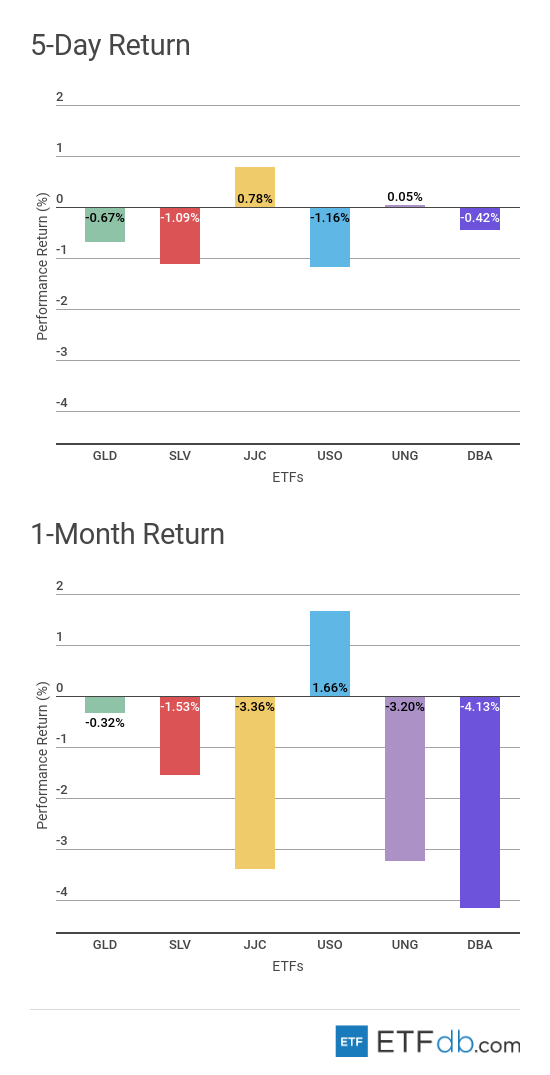
- Commodities were mixed.
- Oil (USO ) took a plunge this week, dropping 1.16%, representing the biggest loss from the pack. For the rolling month, however, (USO ) remains the best performer with an advance of 1.66%.
- Copper (JJC ) was the best weekly performer with a tepid rise of 0.78%.
- Agricultural commodities (DBA ) were the worst monthly performers with a fall of more than 4%.
- Use our Head-to-Head Comparison tool to compare two ETFs such as (JJC ) and (USO ) on a variety of criteria such as performance, AUM, trading volume and expenses.
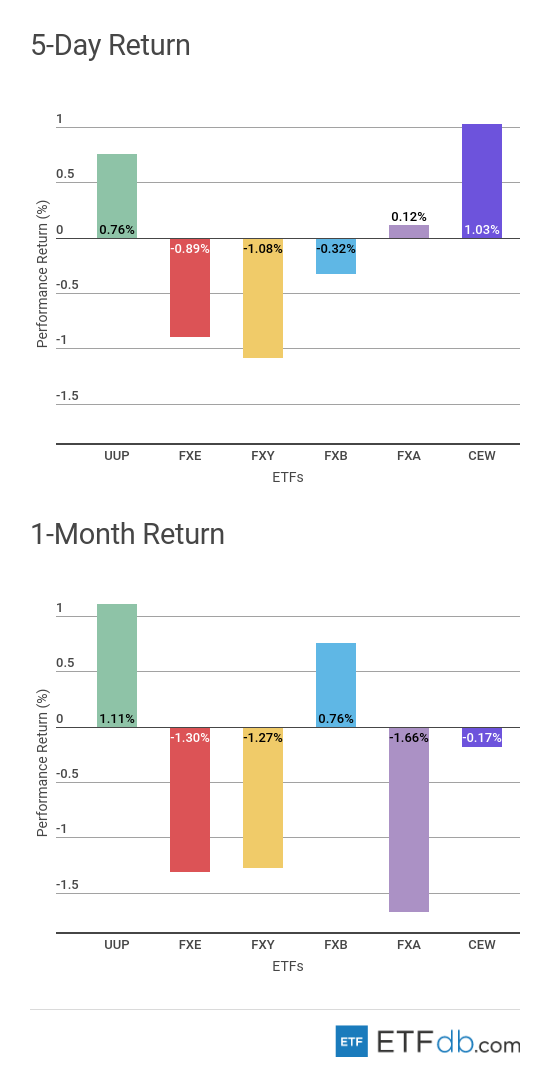
Currency Review
- Emerging market currencies (CEW ) were the strongest from the stable this week, edging up 1.03%.
- The Japanese yen (FXY ) fell the most this week, with losses exceeding 1%.
For more ETF analysis, make sure to sign up for our free ETF newsletter.
Disclosure: No positions at time of writing.

