
China retaliated by floating a 25% levy on U.S. soybean imports, sending the commodity’s price plunging and gearing up for a high-stakes clash between the two countries.
While soybeans ranked first on the list, it also caused Brazil to enter the podium due to its position as the second-largest soybean producer in the world and also a potential beneficiary of the trade spat between the U.S. and China. Homebuilders came in third as new home orders surged amid a strong housing demand that benefits from low unemployment and rising wages. Volatility continued to be of interest as markets ebb and flow amid global political uncertainty, while small-cap value equities are appealing to investors who just got out of the big names.
China Strikes Back and Aims at Trump's Voter Base
The report of an impending 25% tariff on U.S. soybeans from the Chinese authorities caught investors by surprise as few were expecting such a forceful response. Traffic to Soybeans ETFs skyrocketed by 403% as investors looked for clues in the trade puzzle that has roiled financial markets over the last three months.
China pulled the trigger in response to the $50 billion in levies on a slew of high-tech Chinese goods announced a week before. The response targeted soybeans but also includes duties on other agricultural goods such as wheat, corn, cotton, sorghum, tobacco and beef – totaling 106 products ranging from aircrafts to chemicals. Soybean exports are the second-most valuable U.S. export to China, at $14 billion over the last year, behind only aircraft exports with $15 billion worth of goods. The $50 billion was thus matched by the Chinese counterpart and accounts for about 30% of China’s imports from the U.S. in 2017, versus less than 10% of China’s exports to the United States.
These measures seem to carry a political weight as well and may point to a desire of diminishing the dangerous status quo in which markets find themselves as a result of numerous trade jabs. The soybean industry is of great importance to the “Farm Belt” states which, in turn, are close to the ears of President Trump and his administration.
Although Teucrium Soybean (SOYB ) suffered from U.S.-China trade frictions over the last month, it found a base around $18.60, a level from which it recently spiked to hold a 6.71% gain for the year.
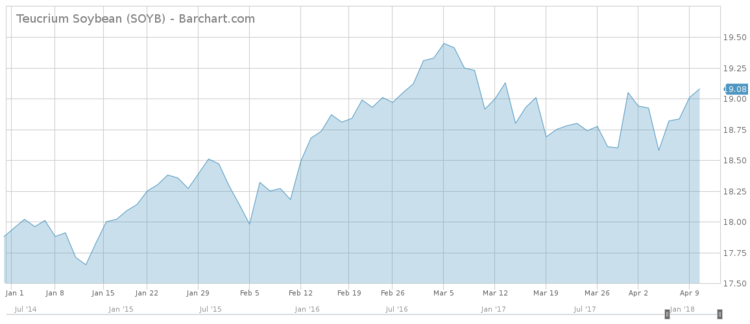
The initial effect on soybean prices was reversed on hopes that tariffs could be avoided as President Xi gave a conciliatory speech at a forum in Asia in which he argued for lower trade barriers and promised to further open China’s economy.
Brazil Set to Gain From Trade War
The prospect of a trade war between China and the U.S. has propelled the Brazilian economy into the attention of investors targeting exposure to agricultural companies. The recently revealed intention of imposing levies on U.S. grains and machinery by the Chinese government caused a 105% spike in the viewership of Brazil ETFs.
Brazil is second only to the U.S. when it comes to soybean exports and sells $21 billion worth of the grain worldwide. In 2012, Brazil replaced the U.S. as the top soybean exporter to the Chinese market and hit a record 53.3% market share in 2017. In contrast, the U.S. sold only 32.9 million tonnes, or 34.4%, to the Asian counterpart, the exporter’s lowest share since at least 2006.
Following a record soybean production of 117 million tonnes in 2017, Brazil is set to match its market share this year as well, adding pressure to the already embattled farmers across the U.S. Midwest plains. China’s move to slap tariffs on U.S. farm products sent Brazil soy premiums surging to historic highs as traders are expecting to see a shift of China’s agricultural sourcing from the U.S. to Brazil and other Latin-American exporters. However, the shift would take time as the robust demand for soybeans on the Chinese market is set to further expand, while Brazil already ships 75% of its production.
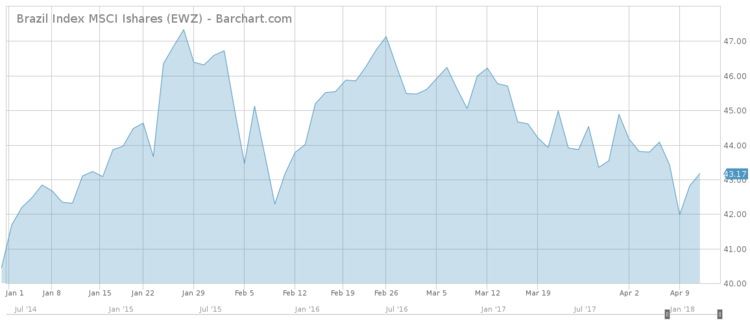
The iShares MSCI Brazil ETF (EWZ ), which tracks the largest and most liquid companies that are domiciled in the South American nation, hasn’t yet profited from trade advantages as political unrest caused stock sell-offs. (EWZ ) still holds a 7.7% gain for the year but could return to the late-January highs once the political standoff ends.
Homebuilders Expect Energic Spring
U.S. homebuilder Lennar (LEN) reported strong first-quarter results on April 4 as high demand lifts prospects on the U.S. housing market. Interest in homebuilders ETFs surged by 93% as investors cheered the better-than-expected results of the largest U.S. homebuilder by revenue.
Lennar sold 6,765 homes during the quarter, up 24% from last year’s 5,453. The upsurge comes in part from the February acquisition of smaller rival CalAtlantic, a $9.3 billion merger poised to increase production efficiency. The average sales price also rose 7.7 percent to $393,000 and is expected to reach 405,000 in fiscal 2018 due to supply shortage and higher demand as low unemployment and rising wages provide momentum for the industry. Orders, a key indicator of future revenue for homebuilders, also rose 30.4 percent to 8,456 homes in the quarter.
The leading U.S. homebuilder saw its shares rising by almost 10%, while other homebuilders like D.R. Horton Inc. (DHI) or Toll Brothers (TOL) also rose 7.3% and 4%, respectively, on a day when the vast majority of U.S. stocks traded lower on concerns of a U.S.-China trade war.
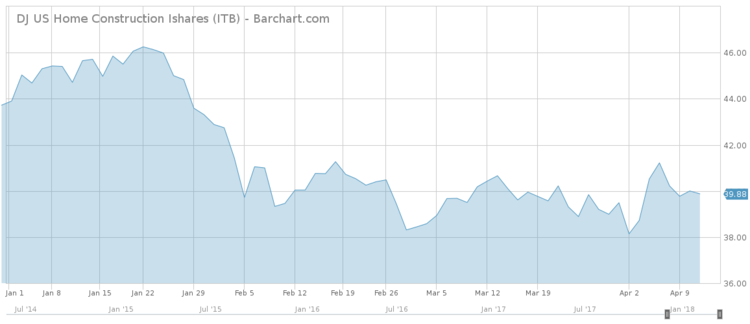
The leading ETF offering exposure to large U.S. homebuilders, the iShares U.S. Home Construction ETF (ITB ), posted a hefty 6.5% gain on April 4, the day Lennar disclosed its financial results. However, the ETF continues to find itself in negative territory, with a 9% year-to-date decline as the higher raw material costs and a chronic shortage of labor, coupled with a lower limit on mortgage tax deduction under the new tax law, have raised concerns of a slowdown in long-term demand.
Volatility Spikes Amid Investor Anxiety
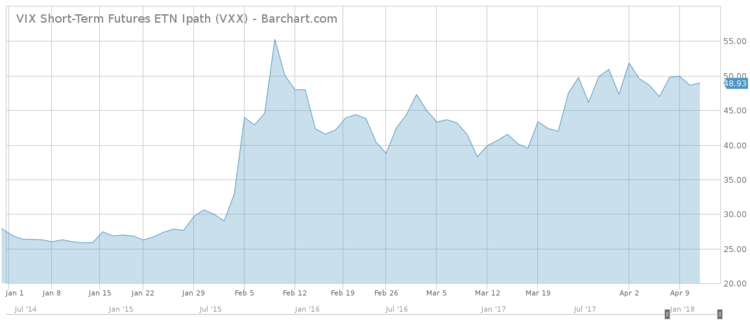
Volatility ETFs enjoy continuous sympathy from investors, triggering a rise in traffic of 57%. Since the brutal sell-off in the first days of February, world markets are shattered by continuous turbulence as investors weigh the potential effects of a trade war between China and the U.S.
As a result, volatility products such as the iPath S&P 500 VIX Short-Term Futures ETN (VXX ) caught investors’ attention with its stellar 75% performance for the year. After it was beefed up in the first days of February, the ETF linked to an index comprised of VIX futures rode the volatile trend and proved resilient to outflows.
Small-Cap Equities
While blue-chip companies are suffering from the trade war rhetoric due to their global exposure, small-cap value equities ETFs are appreciated for their firmness because they are better positioned towards benefiting from the domestic agenda of the Trump administration.
Small-cap ETFs have seen cumulative flows of $3.7 billion over the last month and $1.1 billion year-to-date as they are expected to prosper in the new protectionist environment. Given that small-cap companies mainly do business inside the U.S., they are less exposed to a trade war while also standing to benefit more from lower corporate taxes than large caps with high overseas revenues.
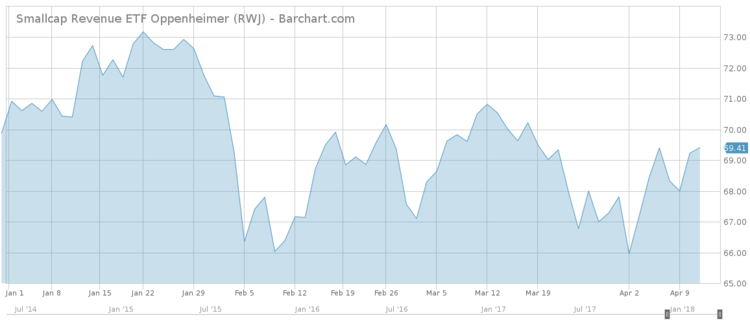
For instance, Oppenheimer Small Cap Revenue ETF (RWJ ) posted a 1.2% gain over the last five trading days but is still in the red for the year, down 0.67%.
On the other side, small caps are far from immune if the U.S. and China engage in a trade war as a lot of these companies service the large-cap giants and any blow to their international business would be felt by their domestic suppliers.
The Bottom Line
Soybean producers and aircraft manufacturers took the brunt of the dangerous trade rhetoric as China looks prepared to go all the way. At the receiving end stands Brazil and its flourishing soybean industry as it posted record crops, eating further into U.S. market share on Chinese grain imports. On the domestic side, homebuilders posted bright financial results as well as encouraging forward guidance. Volatility seems to be embedded in financial markets as investors become accustomed to the stormy climate engulfing international exchanges. Finally, small-cap equities prove enticing for investors seeking to divest from large caps and potentially avoid being hurt by the ongoing trade spat.

