
By Elisabeth Kashner, CFA, VP, Director of Global Fund Analytics, FactSet Research Systems
U.S. ETF flows through June 2022 make little sense, with healthy inflows persisting in the face of sharply falling markets. ETF inflows were stronger in stocks than in bonds, even though stocks fell almost twice as much. Fixed income investors sought to shore up quality and minimize interest rate risk—except when they didn’t. Flows to leveraged products spiked in a shocking display of downside performance chasing. Yet the persistence of investor preference for ever-cheaper funds across asset classes and investment strategies reminds us that price sensitivity remains a powerful force.
The divergence in investor behavior—pinching pennies on costs while adding to risk-on positions—is wide enough to warrant two separate blogs. This article will focus on investors’ macro and strategy preferences. A second article will dig deep into fee compression.
Staring Into the Abyss While Pressing “Buy Now”
The 2022 market correction has been dramatic, with global equities losing 17.67% and U.S. investment-grade bonds down 10.35% through June 30. Yet U.S. ETF flows are on pace to exceed all annual records with the exception of 2021. First half 2022 flows of $332 billion exceed full-year levels for every year from 1993-2016, nearly match full-year 2018 and 2019 flows, and equal 64% of full-year 2020 flows. While global investors offload stocks and bonds, ETF customers have been buyers. Why?
In 2020 and 2021, performance chasing supercharged ETF flows, with growth-seeking and tactical plays in the forefront. So far this year, the performance chasers have stayed away (mostly). ETF inflows have likely come from long-term investors, also known as the buy-and-hold crowd. Tactical investors have shifted their attention to bond ETFs. The fear-of-missing-out (FOMO) buyers made their presence known by crowding into 3x leveraged ETFs—and paid dearly.
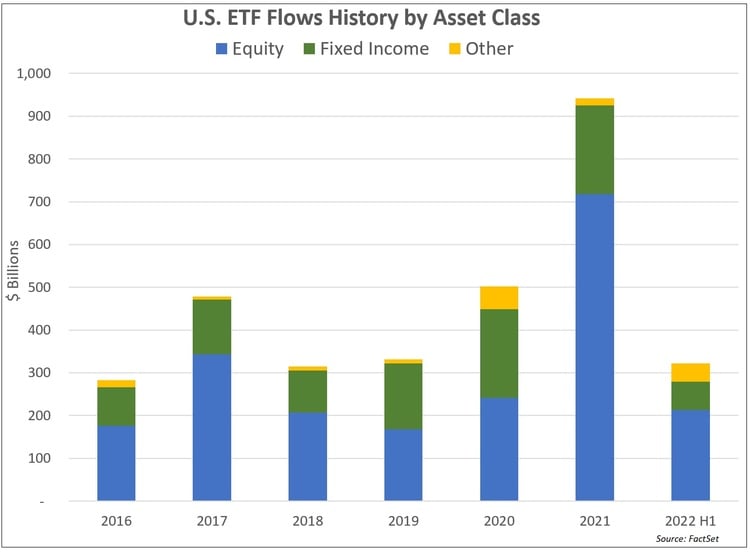
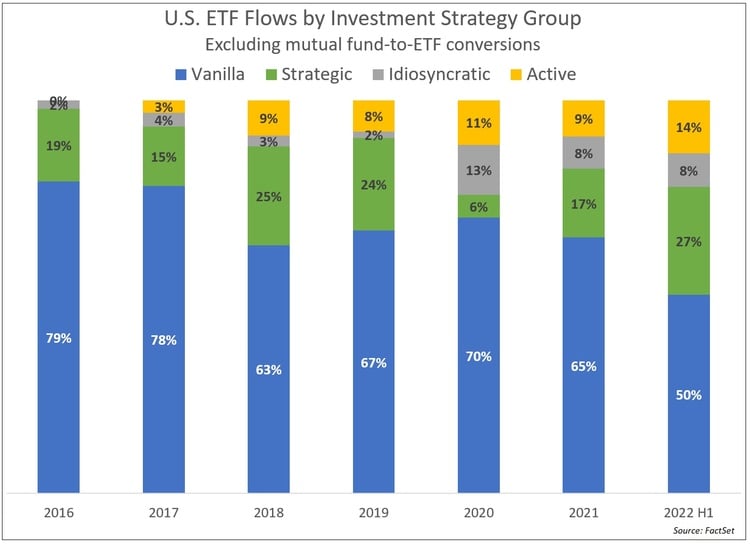
These trends are visible in the two charts below. The first shows ETF flows from 2016 through June 2022, broken down by asset class. The second parses each year’s flows by investment strategy.
Enough is going on that it’s worth exploring investor behavior by asset class, starting with equity.
Equity ETF Trends: Fund Category
At the half-year point, U.S. investors had already added $212 billion to equity ETFs. That’s above full-year levels for 2016, 2018, and 2019, and not far off 2020’s $241 billion. At this pace, annual equity ETF flows will be the second highest ever, save for 2021.
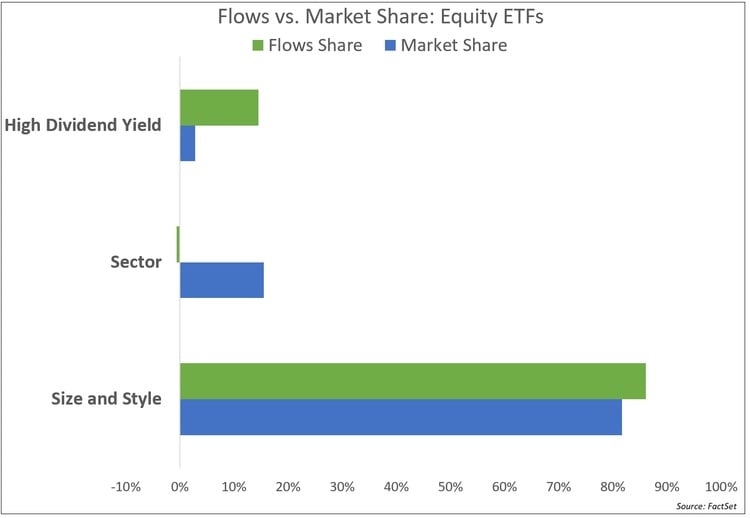
But the composition of equity flows has shifted. Demand for size-and-style funds—those that focus on a total market or target a specific market cap range and style (growth or value)—has outpaced these funds’ starting market share. Sector funds, which comprised 15.5% of equity ETFs, saw outflows. Meanwhile, interest in high-yielding dividend strategies has soared.
Typically, investors use size-and-style funds as core holdings. While some build portfolios block by block, many simply allocate to broad-based total market or large-cap ETFs. 2022’s bear markets have had little effect on this behavior, as ETF investors continued to add to core positions. Vanguard and Blackrock S&P 500 ETFs once again topped the flows table; Vanguard’s Total Stock Market ETF came in fourth. Loyal investors quite possibly appreciated the ability to acquire new buy-and-hold shares at a discount to last year’s prices.
Sector ETFs often comprise the “explore” portfolio allocation. These holdings can shift, as tactics demand. This year, retreat has been in order. Year to date (YTD), sector ETFs bled $1.4 billion, a huge reversal of 2021’s $122 billion inflows.
Instead, equity investors turned to high-dividend-yield ETFs, adding $31 billion, up from 2021’s full year of $22 billion. It’s hard to tell whether this is the newest home for tactical equity or whether it’s a fixed income replacement for investors who foresee a long-term rising rate environment.
Drilling Deeper into Equity ETF Investment Strategy
The pivot away from risk-taking played out not just in tactical positioning, but also in investment strategy selection. So far this year, investors have favored complexity and lower-risk strategies, somewhat complicating the story about steadfast buy-and-hold investors, who have historically been devotees of broad-based, cap-weighted, plain vanilla ETFs.
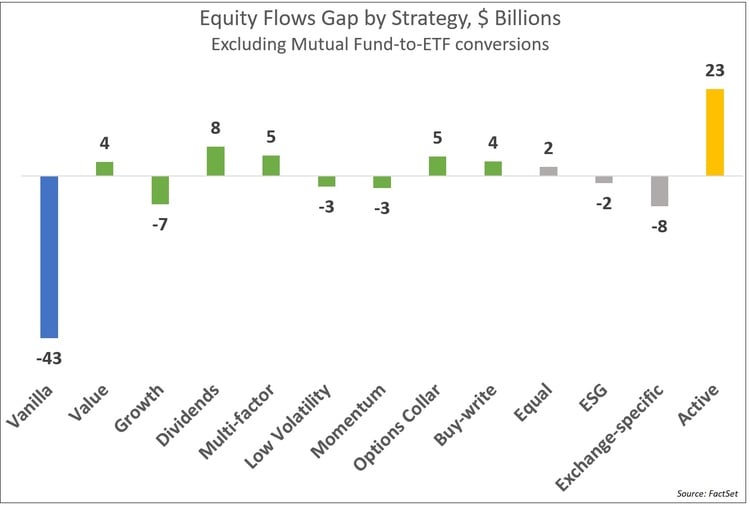
Defensive strategies, especially value and options collars, loomed large, while aggressive exposures like growth, momentum, and single-exchange (such as Invesco QQQ ETF) punched below their weight. ESG lost some of its edge, as investors displayed a taste for yield in their outsized preferences for dividend and option-writing strategies. Notably, active management attracted excess inflows, at the expense of plain vanilla strategies. This held true even excluding mutual-fund-to-ETF conversion flows.
Some popular strategies can replace plain vanilla funds in core portfolios; others are likely to be used tactically. Investors may be testing active management to see if it lowers volatility or increases returns.
For a sense of the scale of investment strategy wins and losses amongst equity ETFs, it’s helpful to look at the gap between expected flows, which are based on market share within an ETF segment, and actual flows.
Fixed Income ETF Trends
Bond ETFs, while still drawing inflows, are on track for their worst organic growth since 2018. Investors have retreated from broad-based core products in favor of tactical picks that allow for controlling credit risk and duration. Mostly, investors have preferred risk-off positions, favoring investment-grade over high-yield and short-term bonds over longer maturities. YTD, $87 billion flowed into investment grade bond ETFs while $18 billion came out of high yield ETFs. The flight to quality is easy to explain, but the maturity preferences are somewhat puzzling.
ETF investors shaded away from broad-maturity ETFs like iShares Core U.S. Aggregate Bond ETF (AGG-US), turning instead to investment-grade ETFs that limit their portfolios by time to maturity. Slice-and-dice bond ETFs across the maturity spectrum saw inflows, especially ultra-short-term and short-term products.
The chart below, which contrasts the share of flows to starting market share by maturity horizon, shows the relative strength of floating-rate and ultra-short-term bond ETFs, and the weakness of broad-maturity ETFs.
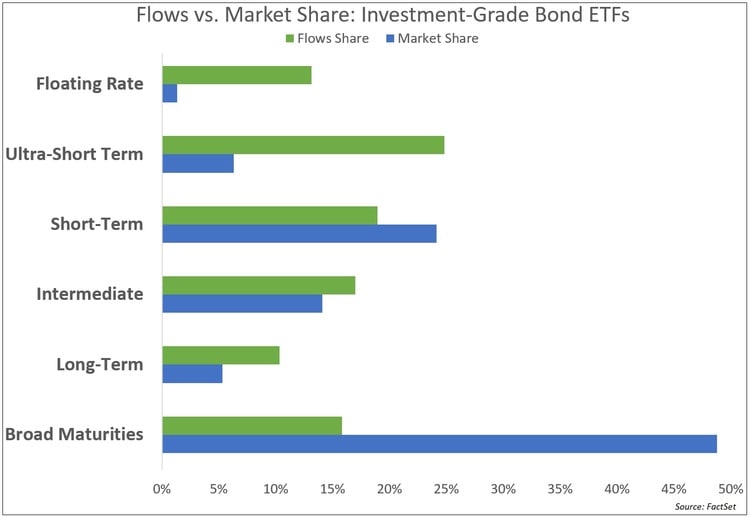
Ironically, intermediate- and long-term bond ETFs captured market share away from broad maturity funds. ETFs that tracked the Bloomberg Aggregate Bond index started 2022 with a weighted average life of 8.5 years and 6.6 duration, which is within the intermediate range.
Long-term bond investors took a risk that failed to pan out. iShares 20+ Year Treasury Bond ETF TLT-US lost 21.96% in the six months through June 2022, while AGG-US gave up just 10.25%.
Geared (Leveraged and Inverse) ETF Flows
It’s hard to explain a movement towards long-term bond ETFs in a rising rate environment. But it’s pretty much impossible to understand the recent preference for leveraged equity ETFs, especially in high-risk strategies or sectors.
Geared ETFs magnify the performance of an underlying security, returning twice, thrice, or some other multiple of the daily performance. Inverse ETFs do the reverse, delivering the exact opposite of the underlying’s performance, generally on a ratio of -1, -2, or -3X. Note that geared ETFs reset their exposures daily, so their long-term performance can’t be predicted and likely won’t reflect the gearing ratio.
Geared funds attracted 8% of YTD flows, vs. a five-year average of 1.2%.
With 2022’s extreme market moves, flows to inverse ETFs could have delivered big gains. Instead, investors added $18.3 billion to leveraged ETFs vs. just $7.3 billion to inverse ones.
A bear market is a terrible time to supersize the use of leveraged ETFs. YTD, investors plowed $9 billion into the 3X ProShares UltraPro QQQ TQQQ-US, which lost 71.2% of its value, and $5.1 billion into Direxion Daily Semiconductor Bull 3x Shares SOXL-US, which lost 80.8%. Their unlevered counterparts fared worse than the overall market, with Invesco QQQ Trust losing 29.3% and iShares Semiconductor ETF shedding 35.3%.
The chart below shows both TQQQ’s flows (blue bars) and its total net asset value (green line).
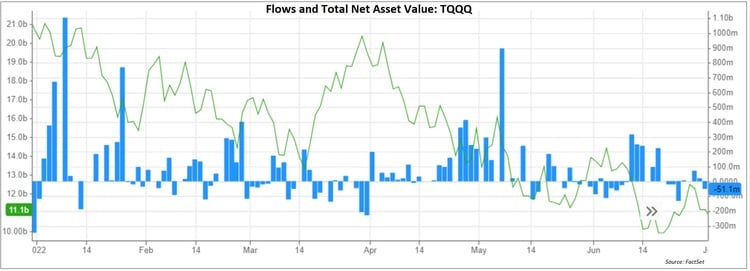
The average investor experience in TQQQ-US and SOXL-US was even worse than the headline returns suggest because of the timing. TQQQ’s dollar-weighted returns were -79.0%; SOXL’s were -83.5%. Of course, hardly any investor received precisely these returns. Many held their positions for hours or days. Most trades don’t result in creations or redemptions and therefore never get recorded as flows, which are key inputs to the dollar-weighted return calculation. But while a few may have done quite well on the handful of days when QQQ and SOXX posted gains, most ETF investors who ventured into these high-risk products got burned, badly.
And this year, the burns were relatively widespread, consuming a large chunk of the 8% of total ETF flows. What a painful lesson.
Worse, geared ETFs cost 0.97% per year, on an asset-weighted basis. Investors who hold a geared ETF for hours or days care about liquidity, not cost. But those who persist in holding these products are learning a second painful lesson: fees matter.
At mid-year, the asset-weighted expense ratio for all U.S. ETFs was just 0.18%. My next blog will chart the progress of fee compression and its effect on the asset management industry. Tactical investor risk-taking has been hard to understand in a bear market. Cost savings makes for a much simpler story.
This blog post is for informational purposes only. The information contained in this blog post is not legal, tax, or investment advice. FactSet does not endorse or recommend any investments and assumes no liability for any consequence relating directly or indirectly to any action or inaction taken based on the information contained in this article.

