ETFdb Logo
  • ETF Database
  • Content Hubs
    • Themes
      • Active ETF
      • Alternatives
      • Artificial Intelligence
      • China Insights
      • Core Strategies
      • Crypto
      • Disruptive Technology
      • Energy Infrastructure
      • ETF Building Blocks
      • ETF Investing
      • ETF Strategist
      • Financial Literacy
      • Fixed Income
      • Free Cash Flow
      • Future ETFs
      • Innovative ETFs
      • Institutional Income Strategies
      • Leveraged & Inverse
      • Market Insights
      • Market Outlooks
      • Modern Alpha
      • Nuclear Energy
      • Portfolio Strategies
      • Sector Investing
      • Tax Efficient Income
      • Thematic Investing
    • Asset Class
      • Equity
        • U.S. Equity
        • Int'l Developed
        • Emerging Market Equities
      • Alternatives
        • Gold/Silver/Critical Materials
        • Cryptocurrency
        • Currency
        • Volatility
      • Fixed Income
        • Investment Grade Corporates
        • US Treasuries & TIPS
        • High Yield Corporates
        • Int'l Fixed Income
    • ETF Ecosystem
    • ETFs in Canada
    • Market Outlook
    • Crypto ETF Hub
  • Tools
    • ETF Screener
    • ETF Country Exposure Tool
    • ETF Database Categories
    • Indexes
    • Scenario Analysis
    • Watchlists
    • Head-To-Head ETF Comparison Tool
    • Mutual Fund To ETF Converter
    • ETF Stock Exposure Tool
    • ETF Issuer Fund Flows
  • Research
    • ETF Education
    • Equity Investing
    • Dividend ETFs
    • Leveraged ETFs
    • Inverse ETFs
    • Index Education
    • Index Insights
    • Top ETF Sectors
    • Top ETF Issuers
    • Top ETF Industries
  • Webcasts
  • Sectors
    • Sector Investing Content Hub
    • XLK
    • XLI
    • XLU
    • XLY
    • XLP
    • XLRE
    • Sector Power Rankings
    • XLE
    • XLC
    • XLF
    • XLV
    • XLB
  • Multimedia
    • ETF 360 Video Series
    • ETF of the Week Podcast
    • Gaining Perspective Podcast
    • ETF Prime Podcast
    • Video
  • Company
    • About VettaFi
  • PRO
    • Pro Content
    • Pro Tools
    • Advanced
    • FAQ
    • Free sign up
    • Login
  1. Chart of the Week: Small-Cap Value ETFs Are Built Differently
News
Share

Chart of the Week: Small-Cap Value ETFs Are Built Differently

Todd RosenbluthMay 25, 2023
2023-05-25

Investors often use index-based style-driven ETFs to support their asset allocation. Despite my efforts, expense ratio is often the most important factor used when choosing an ETF. However, what’s inside is a bigger driver of returns, as we will see with small-cap value ETFs. 

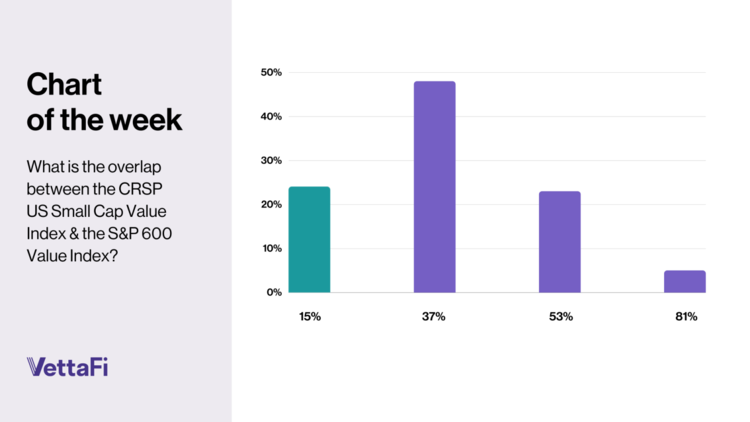
We recently discussed how large-cap value ETFs were gaining traction with advisors, but what they owned was not the same. This is just as notable with small-caps. During a webcast in mid-May with American Century, VettaFi asked advisors, “What is the overlap between the CRSP US Small Cap Value Index & the S&P 600 Small Cap Value Index?” The CRSP index is tracked by the Vanguard Small Cap Value ETF (VBR A+), while the iShares S&P 600 Small Cap Value ETF (IJS A-) seeks to replicate the S&P style benchmark. While the two ETFs sound the same, there’s shockingly just a 15% overlap in the two ETFs. Just under one in four advisor respondents answered correctly when given four choices, with nearly half selecting a 37% overlap.    

Small Value Chart of the Week

Content continues below advertisement

What’s Inside Popular Small-Cap Value ETFs? 

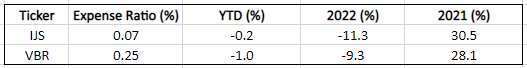
VBR is a $23 billion ETF that has nearly 850 holdings with a median $5.4 billion market capitalization. These include top-10 stakes in Atmos Energy, Builders FirstSource, Bunge, IDEX, and Reliance Steel & Aluminum. Likely aided by its low 0.07% expense ratio, the popular Vanguard ETF gathered approximately $200 million in assets despite losing 1.0% in value year-to-date as of May 19. 

Meanwhile, IJS has $6.5 billion in assets spread across 455 positions that have a median market cap of $1.3 billion. None of VBR’s top-10 positions can be found in IJS. However, the iShares ETF has top-10 positions in companies such as Group 1 Automotive, Insight Enterprises, Meritage Homes, and Signet Jewelers. IJS has a 0.25% net expense ratio, higher than VBR’s, and yet it has been the stronger performer of the pair in 2023. IJS was down only 0.2% thus far at time of writing. In 2023, IJS has incurred approximately $100 million in net outflows. 

From a sector perspective, IJS was more exposed to consumer discretionary stocks (19% vs. 15% for VBR) and information technology (8.8% vs. 5.7%). In contrast, IJS had a lower stake in financials (17% vs. 20%) and industrials (17% vs. 23%). 

Small-Cap Value ETFs Perform Differently 

The approximately 80 basis point gap between the two ETFs thus far in 2023 is nothing new. In 2022, VBR was the stronger performer, declining 9.3%, or less than 200 basis points more than VBR. However, in 2021, IJS rose 31%, approximately 250 basis points more than VBR. Going further back in time, these two ETFs demonstrate relative success. 

Source: VettaFi. As of May 19, 2023

While it is not always clear which small-cap value ETF will outperform each year, the gap between the funds has consistently been much wider than the 18 basis point expense ratio differential. With ETFs, it remains important for advisors to go beyond expense ratios and look inside.  

 For more news, information, and analysis, visit the Financial Literacy Channel.

» Popular Pages

  • Tickers
  • Articles

Jun 24

New Home Sales Drop 7% in May

Jun 24

Are Investors Sleeping on Bitcoin Funds in 2026?

Jun 24

Repositioning the Fed

Jun 24

Small Cap Quality Over Size: Why ALPS OUSM Deserves a Look

Jun 24

The Psychology of FOMO in Markets

Jun 24

Building on Mutual Fund Success: Natixis Loomis Sayles Debuts 2 ETFs

Jun 24

Rosenbluth Discusses Thematics & RAFI Acquisition on Schwab Network

Jun 24

Why Advisors Are Ditching Mutual Funds for Sector ETFs

Jun 24

Considering Large-Cap Value? Here’s How BKDV Stands Out

Jun 24

New China Restrictions Showcase REXC's Ex-China Opportunities

QQQ

Invesco QQQ Trust Series I

VOO

Vanguard S&P 500 ETF

GLD

SPDR Gold Shares

SMH

VanEck Semiconductor ETF

DRAM

Roundhill Memory ETF

SOXX

iShares Semiconductor ETF

PPLT

abrdn Physical Platinum...

SIVR

abrdn Physical Silver Shares...

SCHD

Schwab US Dividend Equity ETF...

SOXL

Direxion Daily Semiconductor...


Content continues below advertisement

Loading Articles...

Advertisement

Is Your Portfolio Positioned With Enough Global Exposure?

ETF Education Channel

How to Allocate Commodities in Portfolios

Tom LydonApr 26, 2022
2022-04-26

A long-running debate in asset allocation circles is how much of a portfolio an investor should...

Core Strategies Channel

Why ETFs Experience Limit Up/Down Protections

Karrie GordonMay 13, 2022
2022-05-13

In a digital age where information moves in milliseconds and millions of participants can transact...

}
X