
Active ETFs issuance has been torrid since 2021. At the start of that year there were 535 active ETFs versus 1,959 passive ETFs. However, as of a June 2025 Morningstar report, the number of active funds had surpassed that of their passive counterparts, at 2,226 compared to 2,157.
True, what Morningstar calls the “organic growth” (cumulative flow relative to beginning net assets for a particular period) of active ETFs has been prodigious. However, their total net assets still pale in comparison to their passive brethren.
Gangbuster Growth
At the end of August 2025, passive ETFs had around $10.9 trillion in assets. That’s 89.8% market share, compared to $1.2 trillion or 10.2% market share for active funds.
However, that was up from the same period one year ago, when passive funds had just under $9 trillion or 92% market share, compared to $744 billion or 7.65% market share for their active brethren.
That taking of more than two percentage points of market share is reflected in the organic growth rate of active funds.
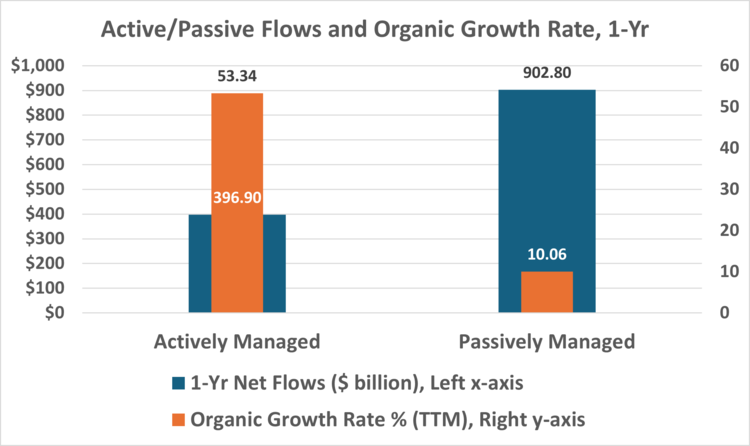
For the one-year period through August, actively managed funds took in $397 billion, while their passive counterparts took in $903 billion. But that means active funds, because they were starting with much fewer assets, had a 53% organic growth rate, while passive funds grew at a 10% clip.
For the month of August, active ETFs took in slightly less than half the amount of assets as passive ETFs, $38.4 billion for active versus nearly $80 billion for passive. But with only 10% market share, that represents an organic growth rate of 3.3% for active funds versus 0.75% for passive funds.
So, for the month, the growth rate of active funds slowed compared to the one-year number. But active ETFs still grew considerably more than passive ETFs.
Getting Granular With Passive ETF Flows
As for individual funds, on the passive side for one year through August, the Vanguard 500 Index Fund (VOO ) led the way in flows, taking in $137 billion. Another S&P 500 tracker, the iShares Core S&P 500 ETF (IVV ) took in $60 billion in new assets, finishing second in the flows derby.
The Morningstar article noted that the Vanguard fund had surpassed the first-ever U.S.-listed ETF, the SPDR S&P 500 ETF Trust (SPY ), after the first seven weeks of this year. It predicted that the SPDR fund is unlikely to regain the lead. SPY’s higher expenses give it a more than 6-basis-point disadvantage, “a small but unnecessary burden” on investors.
The real issue is whether another S&P 500 tracker, IVV, with $639 billion in assets and charging the same expense ratio as VOO, will overtake SPY, which has nearly $671 billion in assets. SPY, itself, pulled in less than $5 billion during the same time period.
In third place, taking in $37 billion for the year, was the iShares Bitcoin Trust ETF (IBIT ). The fund has $87 billion in assets after opening on January 5, 2024.
Two of the top-10 passive funds for one-year inflows were bond funds, the iShares 0-3 Month Treasury Bond ETF (SGOV ), with $31 billion in inflows, and the Vanguard Total Bond Market Index Fund (BND ), with $21.7 billion in inflows.
Active ETF Flows Tell a Different Story
Two active ETFs took in more than $10 billion. The Janus Henderson AAA CLO ETF (JAAA ) gathered $13 billion in new assets, while the JPMorgan Nasdaq Equity Premium Income ETF (JEPI ) took in $12.9 billion.
Seven of the top-10 active funds in flows for the year are bond funds or options-related income strategies. ETFs are better suited than mutual funds to options strategies because of their tax-efficiency, though investors should be aware that selling options generates income against which the ETF structure offers no tax benefits.
| Largest Active ETF Inflows | ||
|---|---|---|
| Fund | Ticker | 1-Yr Net Flow ($ million) |
| Janus Henderson AAA CLO ETF | JAAA | $13,241,346,500 |
| JPMorgan Nasdaq Equity Premium Inc ETF | JEPQ | $12,911,606,673 |
| Fidelity Total Bond ETF | FBND | $8,852,279,386 |
| iShares U.S. Equity Fac Rotation Act ETF | DYNF | $8,793,083,209 |
| Capital Group Dividend Value ETF | CGDV | $8,229,983,800 |
| JPMorgan Ultra-Short Income ETF | JPST | $7,942,312,593 |
| iShares Flexible Income Active ETF | BINC | $7,466,286,189 |
| JPMorgan Equity Premium Income ETF | JEPIX | $7,338,958,610 |
| YieldMax MSTR Option Income Strategy ETF | MSTY | $6,571,653,659 |
| Capital Group Growth ETF | CGGR | $5,869,895,400 |
| Source: Morningstar Direct |
Among the funds with the largest outflows for the last year were two leveraged ETFs — the GraniteShares 2x Long NVDA Daily ETF (NVDL ), with a $2.6 billion loss, along with the 2x Bitcoin Strategy ETF (BITX ) with a $790 million loss.
There’s no investor return data on the NVDA fund, but it’s up more than 42% over the one-year period through August. Investors could be trimming prudently, but it’s possible the breathtaking 80% one-year standard deviation of returns could be shaking them out. The same may be true for the Bitcoin fund, also with no investor return data, but with a 124.8% one-year return and nearly 102% standard deviation of returns.
| Largest Active ETF Outflows | ||
|---|---|---|
| Fund | Ticker | 1-Yr Net Flow ($ million) |
| Quadratic Intrst Rt Vol & Infl H ETF New | IVOL | -$397,877,408 |
| Morgan Stanley Pathway Sm-Md Cp Eq ETF | MSSM | -$506,454,993 |
| Nuveen Growth Opportunities ETF | NUGO | -$509,618,300 |
| TCW Core Plus Bond ETF | FIXT | -$556,692,975 |
| 2x Bitcoin Strategy ETF | BITX | -$790,237,812 |
| ARK Innovation ETF | ARKK | -$1,638,434,150 |
| First Trust Smith Opportnstc Fxd Inc ETF | FIXD | -$1,829,962,000 |
| Morgan Stanley Pathway Large Cap Eq ETF | MSLC | -$1,929,513,662 |
| GraniteShares 2x Long NVDA Daily ETF | NVDL | -$2,626,239,800 |
| Invesco Optm Yd Dvrs Cdty Stra No K1 ETF | PDBC | -$6,324,265,542 |
| Source: Morningstar Direct |
But the Invesco Optimum Yield Diversified Commodity Strategy No K-1 ETF (PDBC ) lost more than any other active ETF, bleeding $6.3 billion. Another big name among the flow losers was the ARK Innovation ETF AARK, with a $1.6 billion loss. The fund finished the month up 32% for the year, making the outflows curious. The fund’s 3-year standard deviation of 44.2 is more than double its Mid-Cap category average of 21.
The Morningstar report forecasts the issuance of more active funds for the remainder of the year, especially more narrow-use funds. However, Morningstar’s “Mind the Gap” annual studies, comparing fund returns to how the average dollar invested in a fund has fared (the investor return), have shown investors have not displayed the ability to use these well.
John Coumarianos is the founder and CEO of Mindful Advisory LLC.
Originally published by Advisor Perspectives
For more news, information, and strategy, visit ETFdb.

