The U.S. economic landscape in April was defined by a significant rebound in inflation across both consumer and wholesale sectors, complicating the path for future monetary policy. While retail sales figures indicated continued consumer activity, the data suggests much of this growth was driven by rising fuel prices rather than increased volume. Together, the latest CPI, PPI, and retail reports paint a picture of an economy grappling with persistent price pressures and a potential shift in long-term interest rate expectations.
Energy Costs Drive Inflation to 3-Year High
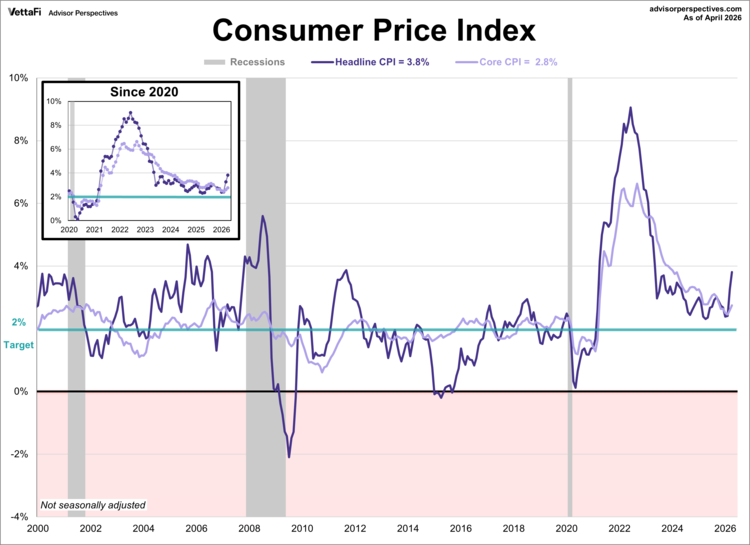
Consumer inflation was higher than expected in April, reaching its highest level in nearly three years. The Consumer Price Index rose to 3.8% last month, a sharp acceleration from March’s 3.3% and slightly higher than the 3.7% forecast. On a monthly basis, prices rose 0.6% as expected. This surge was led by energy, shelter, and food, with energy alone accounting for over 40% of the total increase amid broader price hikes across several other categories.
Core inflation also came in hotter than expected, proving that even when excluded, high energy prices are still leaking into the broader cost of goods and services. The core CPI rose from 2.6% in March to 2.8%, the highest level since September and above the forecast of 2.7%. Additionally, core prices were up 0.4% from the previous month, surpassing the expected 0.3% growth.
Wholesale Price Surge Delivers Warning for Consumer Prices
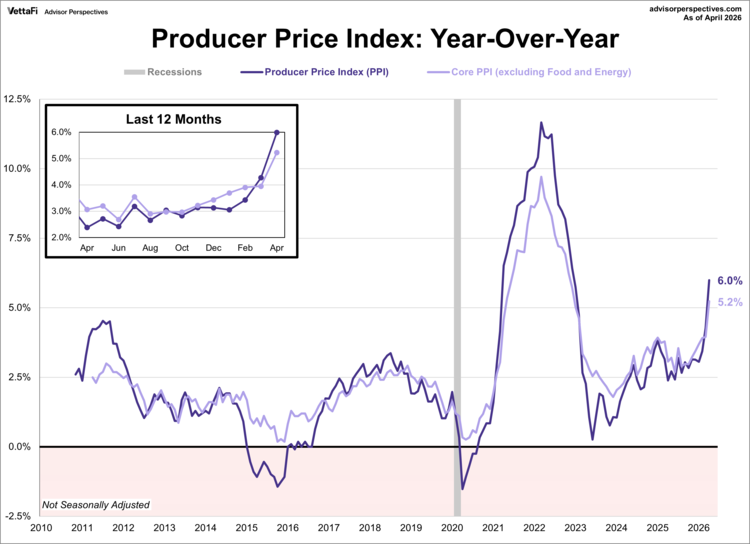
In another setback for inflation watchers the Producer Price Index surged far beyond expectations in April. Headline wholesale inflation jumped to 6.0% annually, a significant acceleration from March’s 4.3% and the highest level seen since 2022. On a monthly basis, prices leaped 1.4%, nearly triple the projected 0.5% increase.
This upward pressure wasn’t limited to volatile sectors. Core PPI also saw its largest monthly gain in over four years, climbing 1.0%. This pushed the annual core rate to 5.2%, well above the 4.3% forecast. Because producers often pass these rising overhead costs directly to the public, this spike in the PPI serves as a troubling leading indicator that consumer-level inflation may not cool anytime soon.
Retail Sales Growth Masks Impact of Higher Fuel Costs
Consumer spending climbed for a third straight month in April, with headline retail sales rising 0.5%. This marked a deceleration from March’s 1.6% surge and was consistent with the forecast. Core sales were up for an eleventh straight month, rising 0.7% as expected. However, for the second month in a row, these figures were heavily skewed by rising expenditures at gas stations. Because retail data is not adjusted for inflation, much of this nominal “growth” reflects the elevated cost of fuel rather than an increase in actual consumer volume.
Control group purchases, which strip out the volatility of gas stations, autos, and building materials to provide a more reliable economic reading, rose 0.5% in April. This marked the fourth consecutive monthly increase and slightly surpassed the 0.4% growth projected by analysts.
Retail sales could impact the SPDR S&P Retail ETF (XRT ), VanEck Retail ETF (RTH ), Amplify Online Retail ETF (IBUY ), and ProShares Online Retail ETF (ONLN ).

Market Reactions
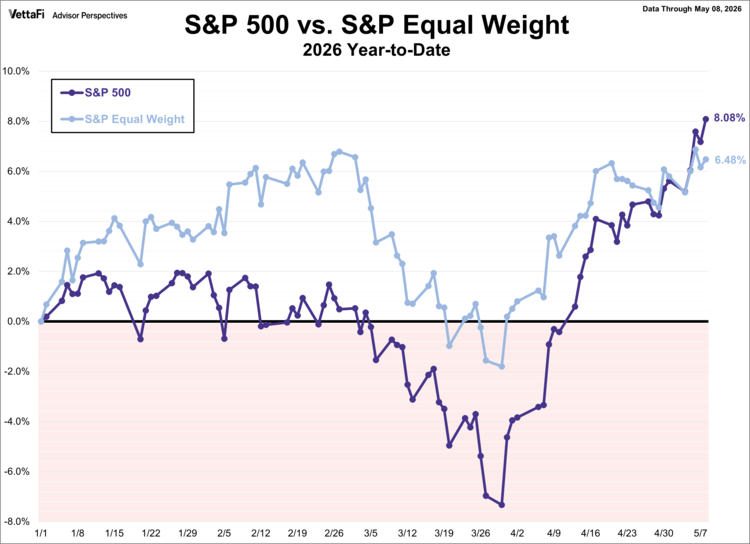
The S&P 500 secured multiple record highs last week but faltered on Friday, retreating 1.2% to mark its steepest daily decline since late March. Even with that pullback, the index managed to finish the week in the green, securing its seventh straight weekly gain and its longest winning streak since 2023. As a result, the SPDR S&P 500 ETF Trust (SPY ) rose 0.2% last week. Meanwhile, the S&P Equal Weight Index was down 1.3% from the previous week and the Invesco S&P 500® Equal Weight ETF (RSP ) fell 1.2%.
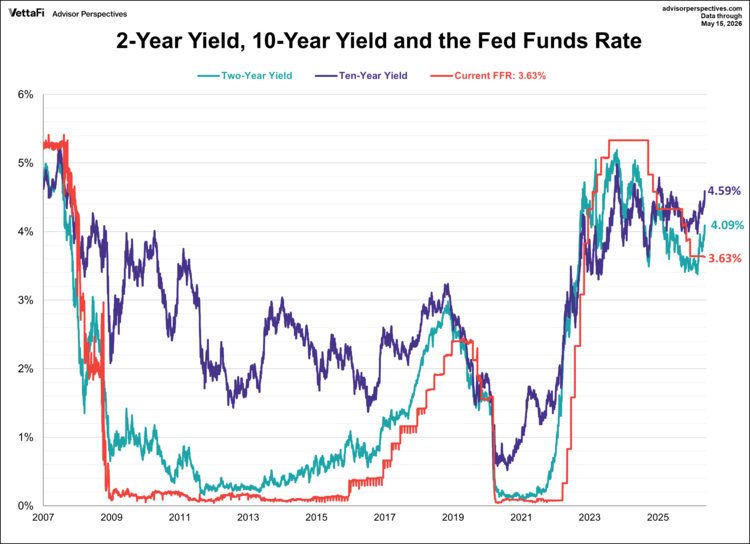
The 10-year Treasury yield finished the week at 4.59%, while the 2-year note finished at 4.09%. This marks the highest level for each since February 2025.
The CMEFedWatch Tool currently shows a 99% likelihood that rates will remain unchanged at next month’s Federal Reserve meeting. While rates are expected to hold steady through the rest of the year, the past week has seen a notable pivot in long-term sentiment with projections now indicating that the next policy shift may actually be a rate hike instead of a cut. Specifically, early 2027 forecasts now price in a 25 basis point increase, followed by no further movement.
Looking Ahead: Economic Data for the Week of May 18, 2026
- Monday: NAHB Housing Market Index (May)
- Tuesday: Pending Home Sales (Apr)
- Wednesday: No notable data
- Thursday: Weekly Jobless Claims, Philadelphia Fed Manufacturing Index (May), Kansas City Fed Manufacturing Index (May), Housing Starts (Apr), Building Permits (Apr)
- Friday: University of Michigan Consumer Sentiment Index (May)
Originally published on Advisor Perspectives
For more news, information, and strategy, visit ETFdb.

