ETFdb Logo
  • ETF Database
  • Content Hubs
    • Themes
      • Active ETF
      • Alternatives
      • Artificial Intelligence
      • China Insights
      • Core Strategies
      • Crypto
      • Disruptive Technology
      • Energy Infrastructure
      • ETF Building Blocks
      • ETF Investing
      • ETF Strategist
      • Financial Literacy
      • Fixed Income
      • Free Cash Flow
      • Future ETFs
      • Innovative ETFs
      • Institutional Income Strategies
      • Leveraged & Inverse
      • Market Insights
      • Market Outlooks
      • Modern Alpha
      • Nuclear Energy
      • Portfolio Strategies
      • Sector Investing
      • Tax Efficient Income
      • Thematic Investing
    • Asset Class
      • Equity
        • U.S. Equity
        • Int'l Developed
        • Emerging Market Equities
      • Alternatives
        • Gold/Silver/Critical Materials
        • Cryptocurrency
        • Currency
        • Volatility
      • Fixed Income
        • Investment Grade Corporates
        • US Treasuries & TIPS
        • High Yield Corporates
        • Int'l Fixed Income
    • ETF Ecosystem
    • ETFs in Canada
    • Market Outlook
    • Crypto ETF Hub
  • Tools
    • ETF Screener
    • ETF Country Exposure Tool
    • ETF Database Categories
    • Indexes
    • Scenario Analysis
    • Watchlists
    • Head-To-Head ETF Comparison Tool
    • Mutual Fund To ETF Converter
    • ETF Stock Exposure Tool
    • ETF Issuer Fund Flows
  • Research
    • ETF Education
    • Equity Investing
    • Dividend ETFs
    • Leveraged ETFs
    • Inverse ETFs
    • Index Education
    • Index Insights
    • Top ETF Sectors
    • Top ETF Issuers
    • Top ETF Industries
  • Webcasts
  • Sectors
    • Sector Investing Content Hub
    • XLK
    • XLI
    • XLU
    • XLY
    • XLP
    • XLRE
    • Sector Power Rankings
    • XLE
    • XLC
    • XLF
    • XLV
    • XLB
  • Multimedia
    • ETF 360 Video Series
    • ETF of the Week Podcast
    • Gaining Perspective Podcast
    • ETF Prime Podcast
    • Video
  • Company
    • About VettaFi
  • PRO
    • Pro Content
    • Pro Tools
    • Advanced
    • FAQ
    • Free sign up
    • Login
  1. Relative Value Investing Content Hub
  2. Is Bigger Better When the Market is Volatile?
Relative Value Investing Content Hub
Share

Is Bigger Better When the Market is Volatile?

Ben HernandezMay 15, 2019
2019-05-15

The steady dose of recent volatility has begged the question of who sustained the most damage: large cap equities or small cap equities?

A chart comparing the S&P 500 and Russell 2000 showed that large cap equities were able to take the gut punch on Monday the best as well blunt the ill effects of volatility the last five days:

Small cap equities absorbing

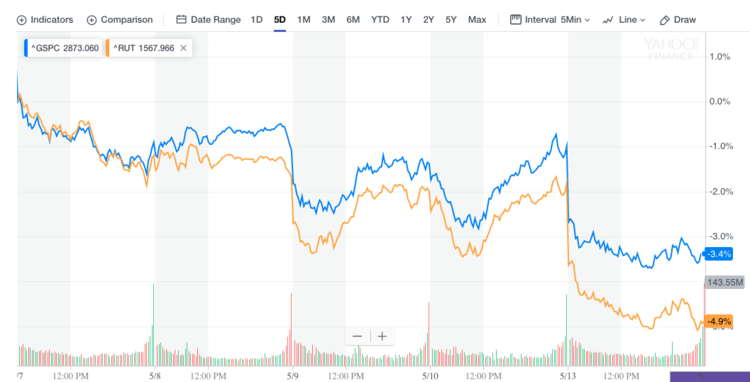
Small cap equities absorbing the brunt of the punishment comes as they were practically neck and neck with large cap equities during the month of April.

Year-to-date performance for U.S. equities have been fueling both large cap and small cap stocks, as both jockeyed for position in April. Thanks to a more accommodating central bank in terms of interest rate policy, the markets have been able to fend off other macro fears like slower global growth.

More help came from the U.S. economy rebounding in the first quarter this year, as it beat analysts’ expectations of 2.5 percent growth with a 3.2 percent growth number. The GDP figure represents the strongest rate of growth for the first quarter in four years and matches the 3.2 percent growth experienced a year ago.

“It has undeniably been quite an extraordinary first four months of the year for broad U.S. markets,” wrote David Mazza, Managing Director and Inkoo Kang, Vice President in Direxion’s latest Relative Weight Spotlight. “The Russell 1000 gained 18.60% (total return) through April, and Small Cap stocks, as measured by the Russell 2000, provided 18.48% through the end of April. To put that into perspective, the last time we saw both Large Caps and Small Caps provide greater than 18% total returns over four months’ time was in December of 2010.

“In terms of seasonality, 2019 provided the strongest January-to-April return for Small Cap stocks since 1991, and the strongest January-to-April return for the Russell 1000 since 1987. As a result, volatility calmed dramatically: the average for the CBOE Volatility Index throughout the first four months of 2019 was 15.56, which was notably lower than the 19.17 average throughout the last four months of 2018.”

From a year-to-date standpoint, it’s the S&P 500 edging the Russell 2000 with a 15 percent edge versus the latter’s 12.94 percent gain. Can this trend sustain itself?

For investors looking for continued upside in large cap equities over small caps, the Direxion Russell Large Over Small Cap ETF (RWLS B) offers them the ability to benefit not only from large cap equities potentially performing well, but from their outperformance compared to their small cap brethren.

Conversely, if investors believe that small cap equities will outperform large cap equities, the Direxion Russell Small Over Large Cap ETF (RWSL C+) provides a means to not only see small cap stocks perform well, but a way to capitalize on their outperformance versus their large cap brethren.

For more relative market trends, visit our Relative Value Channel.


Content continues below advertisement

Loading Articles...

Advertisement

Is Your Portfolio Positioned With Enough Global Exposure?

ETF Education Channel

How to Allocate Commodities in Portfolios

Tom LydonApr 26, 2022
2022-04-26

A long-running debate in asset allocation circles is how much of a portfolio an investor should...

Core Strategies Channel

Why ETFs Experience Limit Up/Down Protections

Karrie GordonMay 13, 2022
2022-05-13

In a digital age where information moves in milliseconds and millions of participants can transact...

}
X