
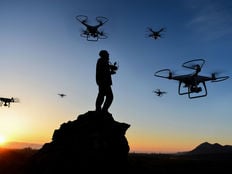
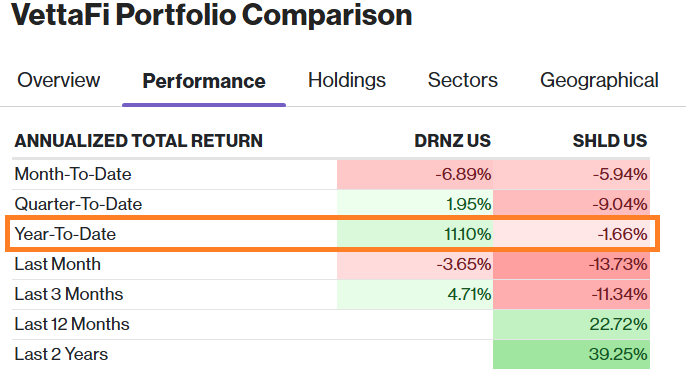
Exchange-traded funds (ETFs) are rarely identical, and drone ETFs are no exception. Though a relatively new entry into the burgeoning drone ETF space, the REX Drone ETF (DRNZ) is already outflying the Global X Defense Tech ETF (SHLD ) in a total return dogfight this year. The former is up 11% while the latter is down 1.7%.
Key Takeaways:
- Portfolio diversification across sectors and market caps allows DRNZ to capture high-growth innovators that SHLD’s large-cap, industrial-heavy mandate misses.
- Geographic exposure beyond North America and Europe gives DRNZ a global edge in identifying autonomous flight breakthroughs in emerging tech hubs.
- High conviction in pure-play holdings like NextVision provides DRNZ with significant performance lift compared to the legacy-weighted and more diluted structure of SHLD.
Pure-Play Diversification
The performance gap between the two funds can be traced to their underlying indexes. By tracking the Global X Defense Tech Index, SHLD aptly tilts toward technology that supports military applications. On the other hand, DRNZ casts a wider net in terms of sector exposure by tracking the VettaFi Drone Index.
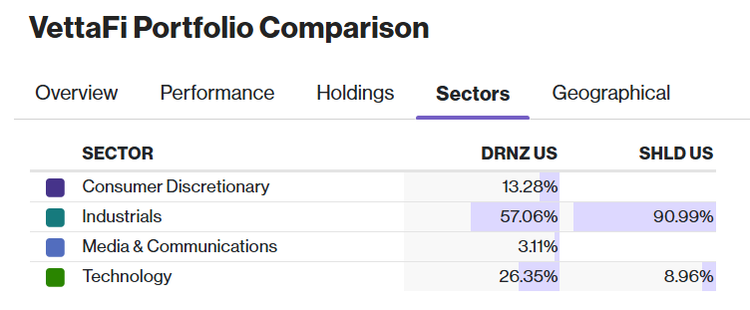
As noted in its sector breakdown, SHLD is dominated by industrials, with 91% exposure that’s lightly paired with a 9% allocation into technology. DRNZ, on the other hand, is only 57% exposed to industrials, while allocating 26% into technology. The rest of DRNZ is dispersed among consumer discretionary (13.3%) and media & communications (3.1%), sectors where SHLD has no allocations.
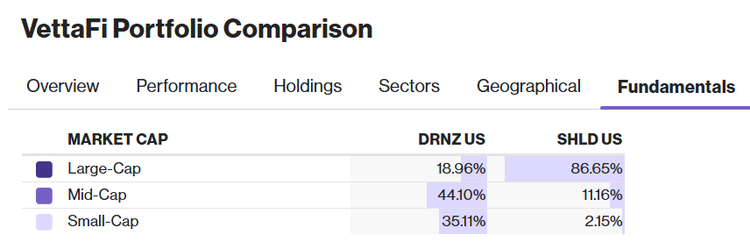
The diversification is further punctuated when looking at market cap exposure. The vast majority of SHLD (87%) is exposed to large-cap companies with just 13.3% into mid- and small-caps combined. Meanwhile, DRNZ is just 19% exposed to large-caps, while 44% is in midcaps and 35% in small-caps. Though smaller in cap size, mid- and small-caps can also provide outsized performance relative to their large-cap peers. With the drone industry still in its nascent stages of growth, DRNZ can capture industry innovators in the process of developing the proprietary AI and swarm-flight algorithms that are representative of the next frontier of drone tech.
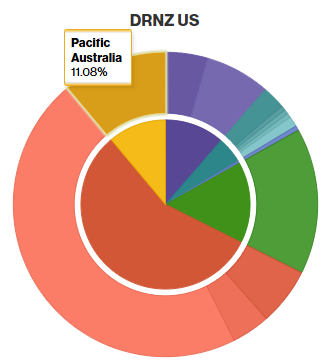
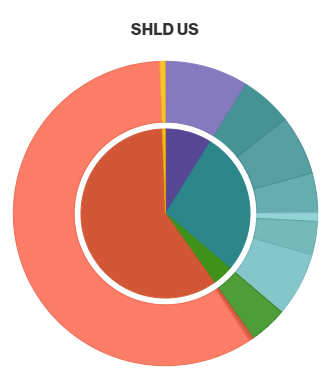
The diversification disparity continues when looking at geographical exposure. While both funds weigh heavily towards companies domiciled in North America, DRNZ has a larger global footprint to capture growth opportunities outside U.S. borders.
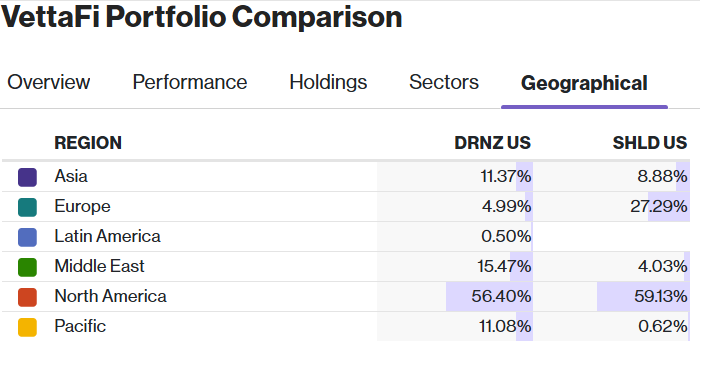
This is evident in greater country exposure to Asia, the Middle East, Pacific Australia, and Latin America.
Conversely, 86% of SHLD is in North America and Europe combined.
Minimal Overlap Makes DRNZ Fly
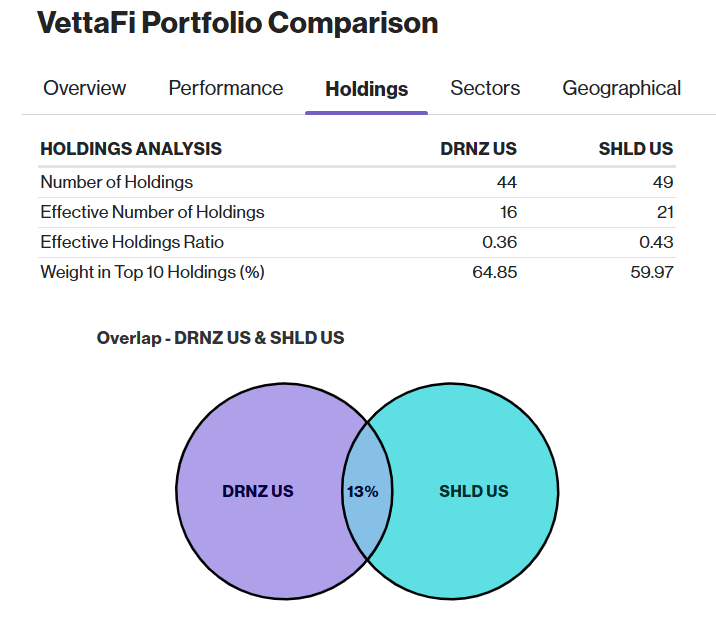
Their holdings highlight the distinction between the two funds. DRNZ and SHLD have a minimal 13% overlap, proving that the performance drivers aren’t shared.
A look at the top 10 holdings of both also explains the performance gap further. Occupying the top three holdings of DRNZ are NextVision Stabilized Systems (13.3%), Ondas Inc. (11.5%), and AeroVironment (10.9%). These are high-beta, specialized firms that have the tendency to move aggressively on industry-specific news.
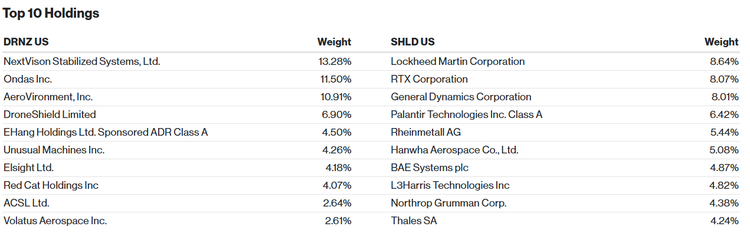
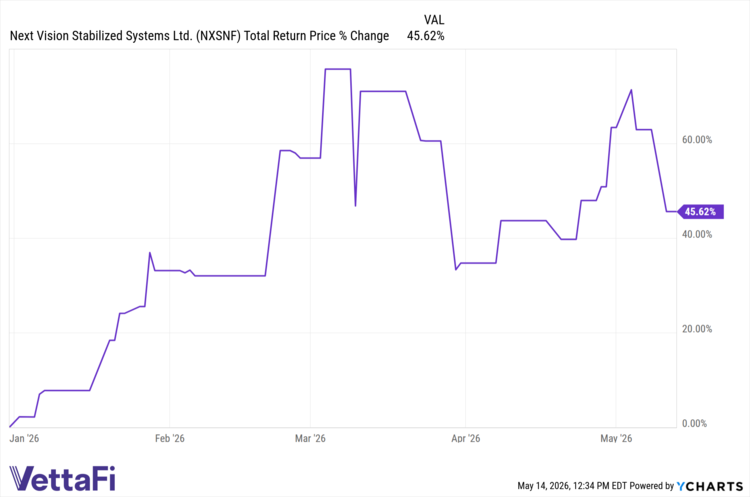
As the top holding, NextVision is driving much of the fund’s performance, with a 46% gain YTD.
In contrast, SHLD is anchored by legacy aerospace and defense (A&D) names in its top three — Lockheed Martin (8.6%), RTX Corporation (8.07%), and General Dynamics (8.01%). While these companies tend to be less volatile, returns are often tied to government budget cycles, as opposed to technological breakthroughs in the drone industry, where DRNZ’s exposure has the advantage.
Moreover, SHLD maintains a higher effective holdings ratio (0.43 vs. DRNZ’s 0.36). This suggests the fund distributes its weight more evenly across its effective names, which again, can contribute to its less volatile nature, but potentially sacrifices performance. The ratio also indicates that DRNZ has a higher conviction in its top holdings, such as NextVision. This deliberate concentration has allowed DRNZ to achieve superior lift compared to the more balanced, legacy-weighted SHLD.
The Strategic Choice
Of course, total return performance is just one aspect to consider when comparing both funds. It boils down to investor objectives when choosing which fund best suits their portfolio.
SHLD is ideal for those seeking large-cap exposure to the status quo of defense spending. DRNZ offers differentiated exposure to drone technology by stripping away traditional A&D exposure. The fund focuses on the high-growth, high-margin future of up and comers in the drone tech industry across various sectors. As already seen in the 2026 YTD performance, when the drones fly, DRNZ has the potential to go high.
| Feature | REX Drone ETF | Global X Defense Tech ETF |
|---|---|---|
| Ticker | DRNZ | SHLD |
| Inception Date | October 29, 2025 | September 11, 2023 |
| Expense Ratio | 0.65% | 0.50% |
| Underlying Index | VettaFi Drone Index | Global X Defense Tech Index |
| Selection Universe | Focuses on pure-play companies deriving 50%+ revenue from drones, UAVs, and autonomous flight systems. | Broad defense technology including cybersecurity, big data, and legacy aerospace industrial giants. |
| Primary Exposure | Unmanned systems, sensors, and drone AI software. | Defense electronics, traditional hardware, and military IT. |
For more news, information, and analysis, visit the Thematic Investing Content Hub.
VettaFi LLC (“VettaFi”) is the index administrator and calculation agent for DRNZ, for which it receives a fee. However, DRNZ is not issued, sponsored, endorsed, or sold by VettaFi, and VettaFi has no obligation or liability in connection with the issuance, administration, marketing, or trading of DRNZ.

